Fig. 5
Download original image
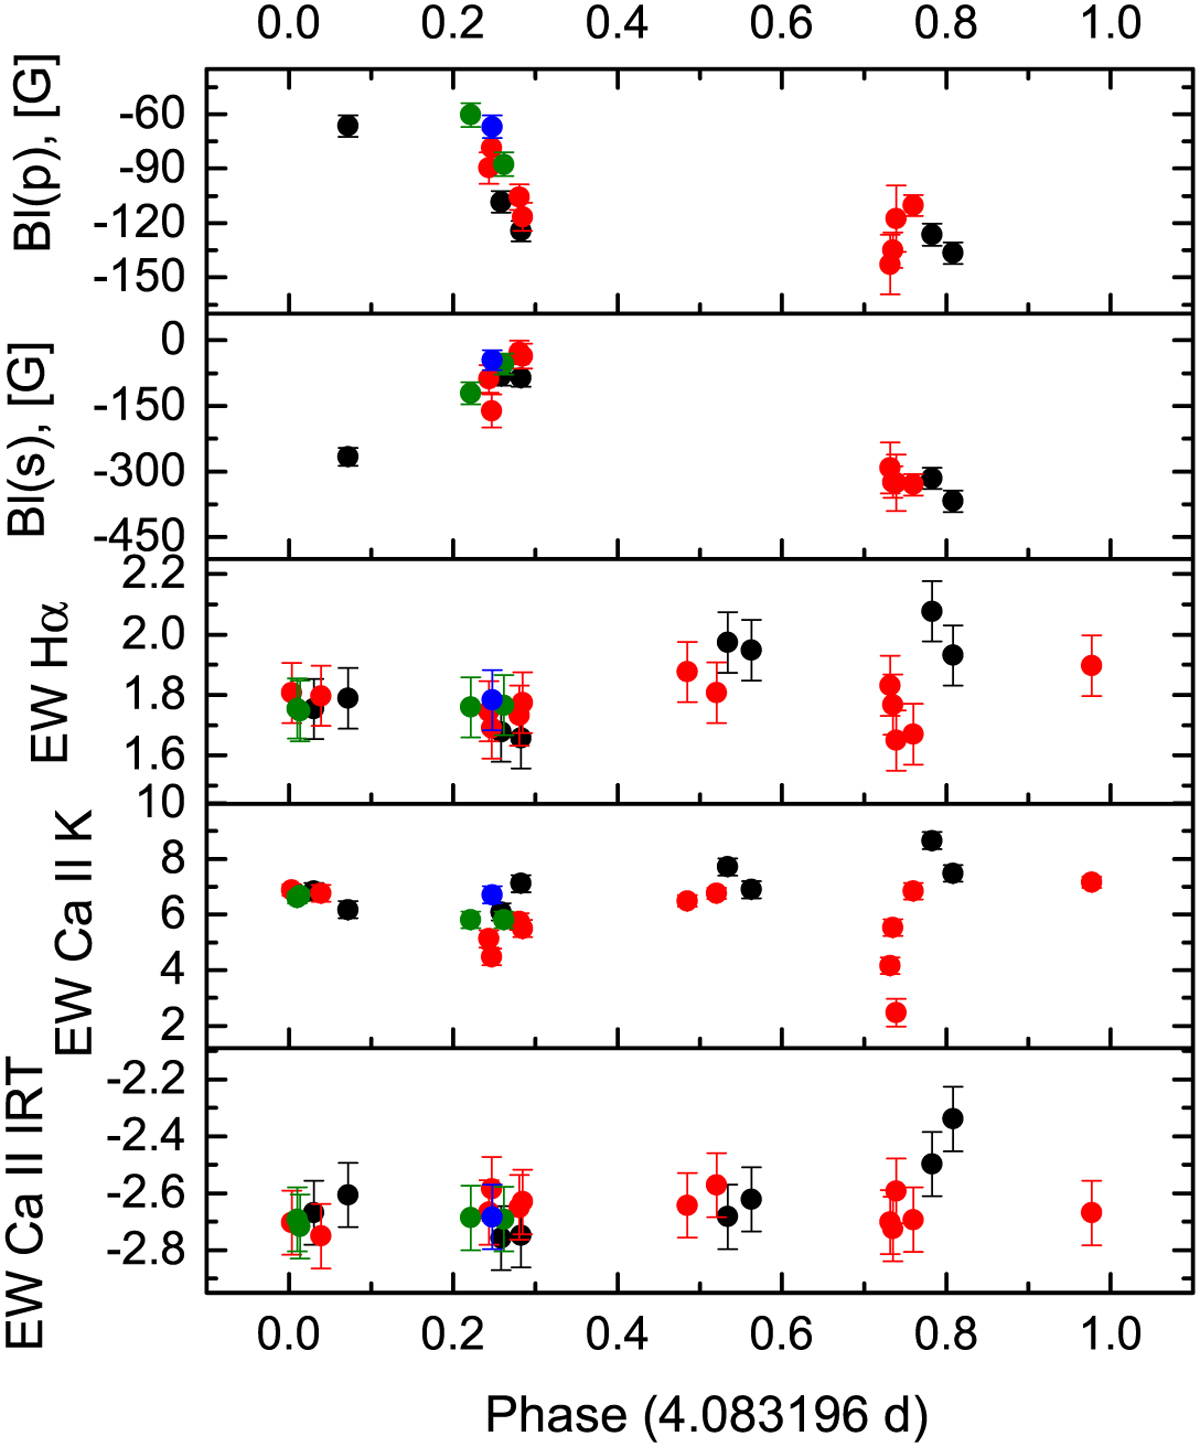
Time variability of the magnetic field and line activity indicators of FK Aqr. First two plots from top to bottom show the variability of the longitudinal magnetic fields Bl of the two components of the system in the period 3–16 September 2014 (where (p) and (s) stand for the primary and secondary, respectively). Observations are phased and the rotational cycles are denoted in black, red, green, and dark blue colours corresponding to the first, second, third, and fourth cycles. The last three plots show the variability of the equivalent widths of the spectral lines, given in Å. All error bars are plotted, but some of them are within the symbols.
Current usage metrics show cumulative count of Article Views (full-text article views including HTML views, PDF and ePub downloads, according to the available data) and Abstracts Views on Vision4Press platform.
Data correspond to usage on the plateform after 2015. The current usage metrics is available 48-96 hours after online publication and is updated daily on week days.
Initial download of the metrics may take a while.