Fig. 5.
Download original image
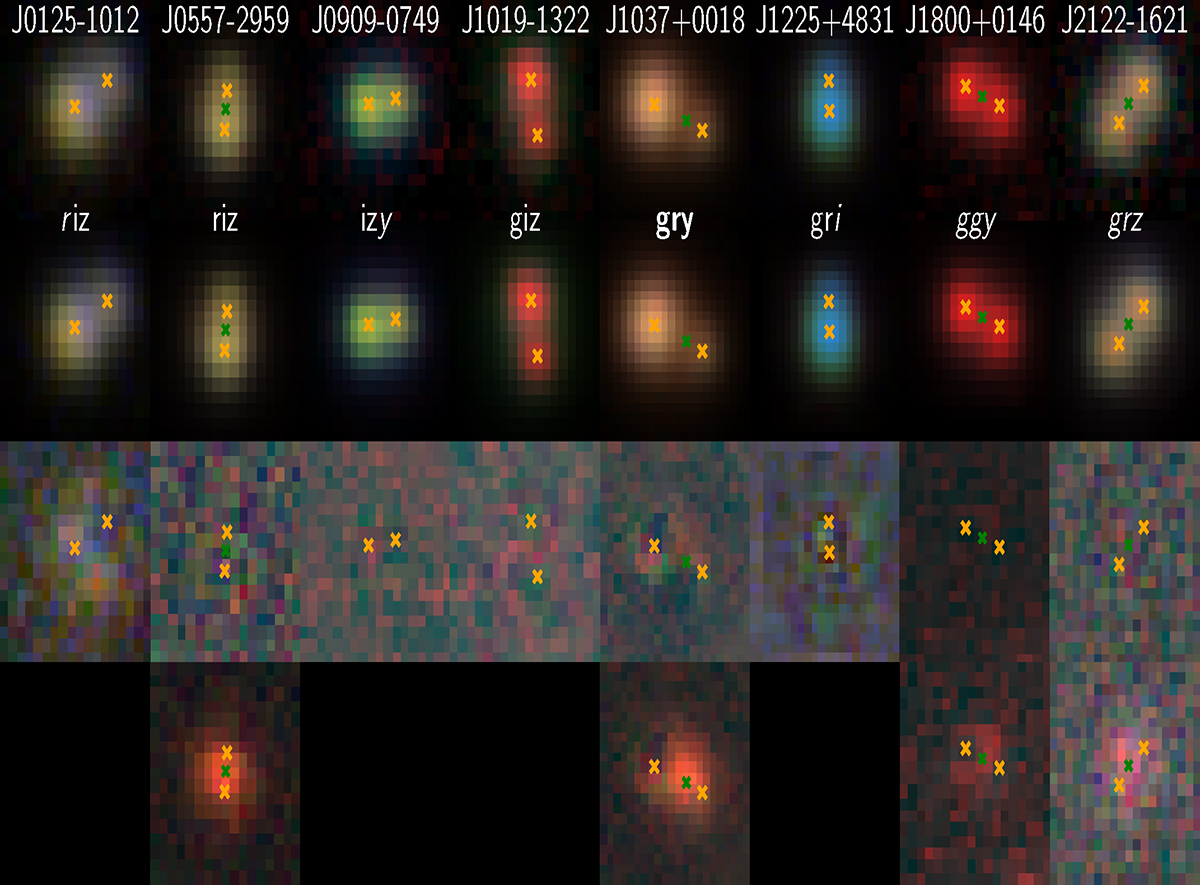
Selection of the best-quality survey data and the modelling of these data. First row: Legacy Survey, Pan-STARRS (italicised), or HSC (bold) data. Second row: Models with 2 PSFs and an additional Sérsic profile when it significantly improves the modelling. Third row: Residuals after subtraction of the models. Fourth row: When the model has a Sérsic profile, residuals after subtraction of the PSFs alone. The bands are arranged by wavelength (redder first) and Lupton-stretched, highlighting the redder hue of the lensing galaxies seen in the fourth row compared to the quasar pairs.
Current usage metrics show cumulative count of Article Views (full-text article views including HTML views, PDF and ePub downloads, according to the available data) and Abstracts Views on Vision4Press platform.
Data correspond to usage on the plateform after 2015. The current usage metrics is available 48-96 hours after online publication and is updated daily on week days.
Initial download of the metrics may take a while.