Fig. 3.
Download original image
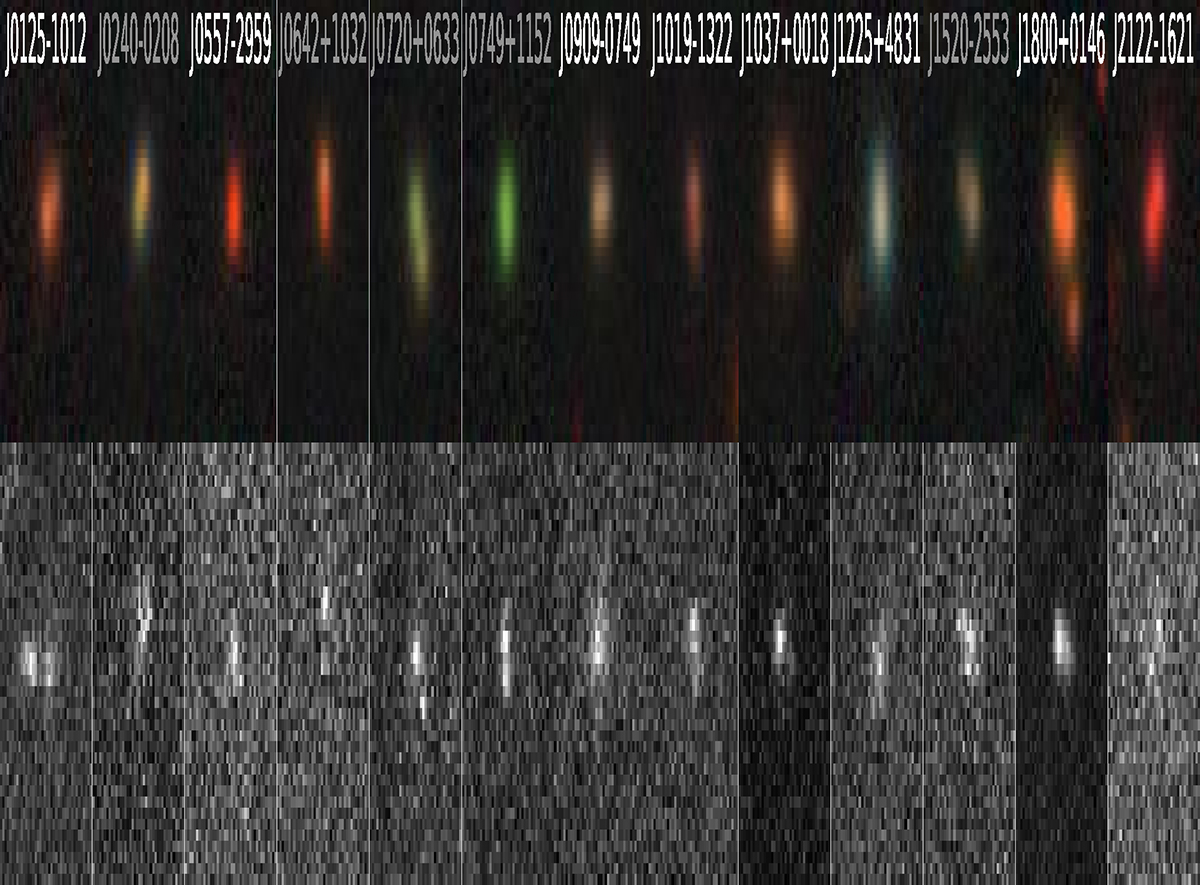
Pan-STARRS Lupton-stretched (Lupton et al. 2004) gri views (top) and r+i variability maps (bottom) of the candidates selected for spectroscopic follow-up. Extended variability is still well visible for all the candidates, even though it sometimes barely rises above the noise. Candidates that are found to be false positives are displayed in grey, and the quasar pairs are displayed in white. The variability map of PS J0125−1012 includes an artefact.
Current usage metrics show cumulative count of Article Views (full-text article views including HTML views, PDF and ePub downloads, according to the available data) and Abstracts Views on Vision4Press platform.
Data correspond to usage on the plateform after 2015. The current usage metrics is available 48-96 hours after online publication and is updated daily on week days.
Initial download of the metrics may take a while.