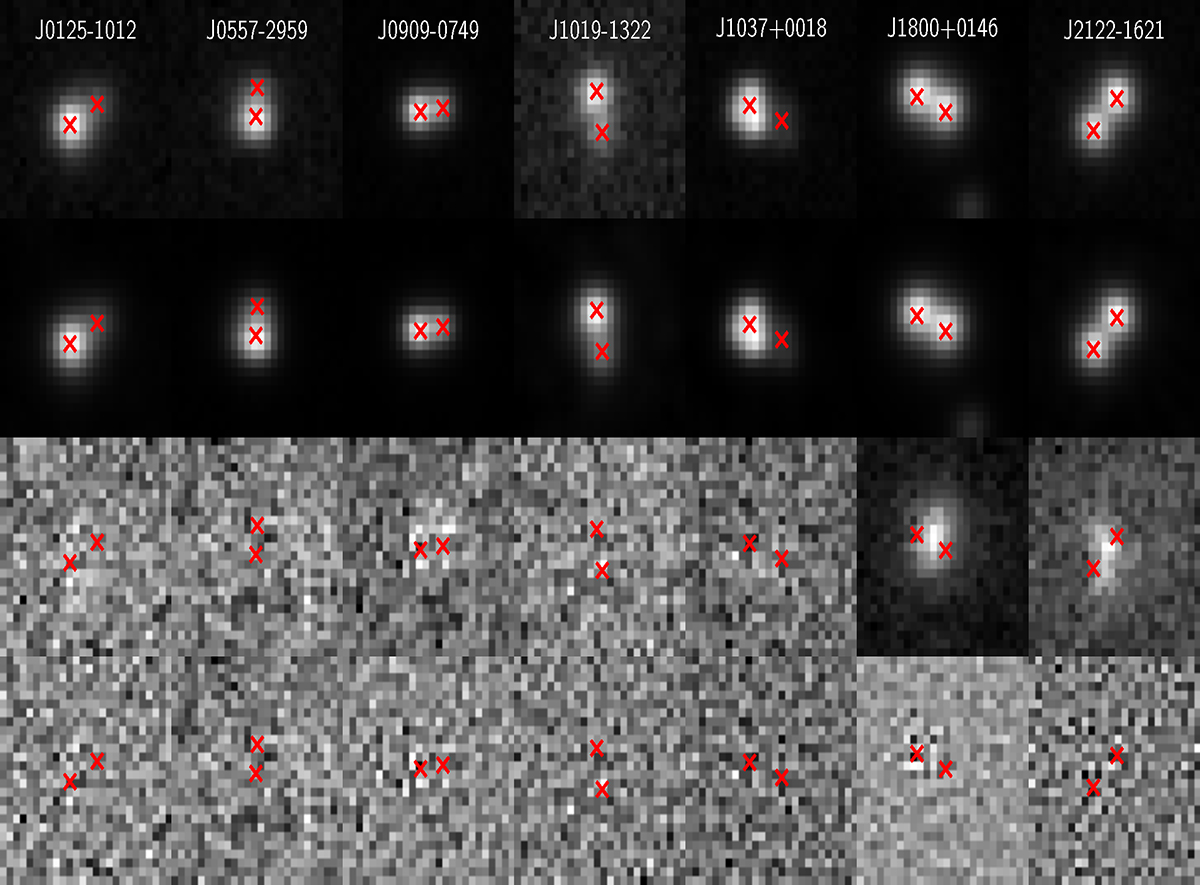
Fig. 2.
Download original image
MPIA 2.2-m telescope Rc-band data and models of the candidates visible from La Silla Observatory. First row: Stacked exposures (4 × 320 s). Second row: Modelling of the systems using the STARRED algorithm. Third row: Residuals after subtractions of the point-source component of the STARRED model. Last row: Residuals after subtraction of the complete STARRED model (PSFs + background). Each row shows a stack, but the data were deconvolved jointly. The red crosses indicate the positions of the PSFs, the separations of which are close to the Gaia separations down to 0.01″ (Table 1). At this depth and filter, the lensing galaxy is well detectable in only the two brightest objects. We provide the deconvolution-obtained magnitudes of this 2p2 data in Appendix B.
Current usage metrics show cumulative count of Article Views (full-text article views including HTML views, PDF and ePub downloads, according to the available data) and Abstracts Views on Vision4Press platform.
Data correspond to usage on the plateform after 2015. The current usage metrics is available 48-96 hours after online publication and is updated daily on week days.
Initial download of the metrics may take a while.