Fig. 1.
Download original image
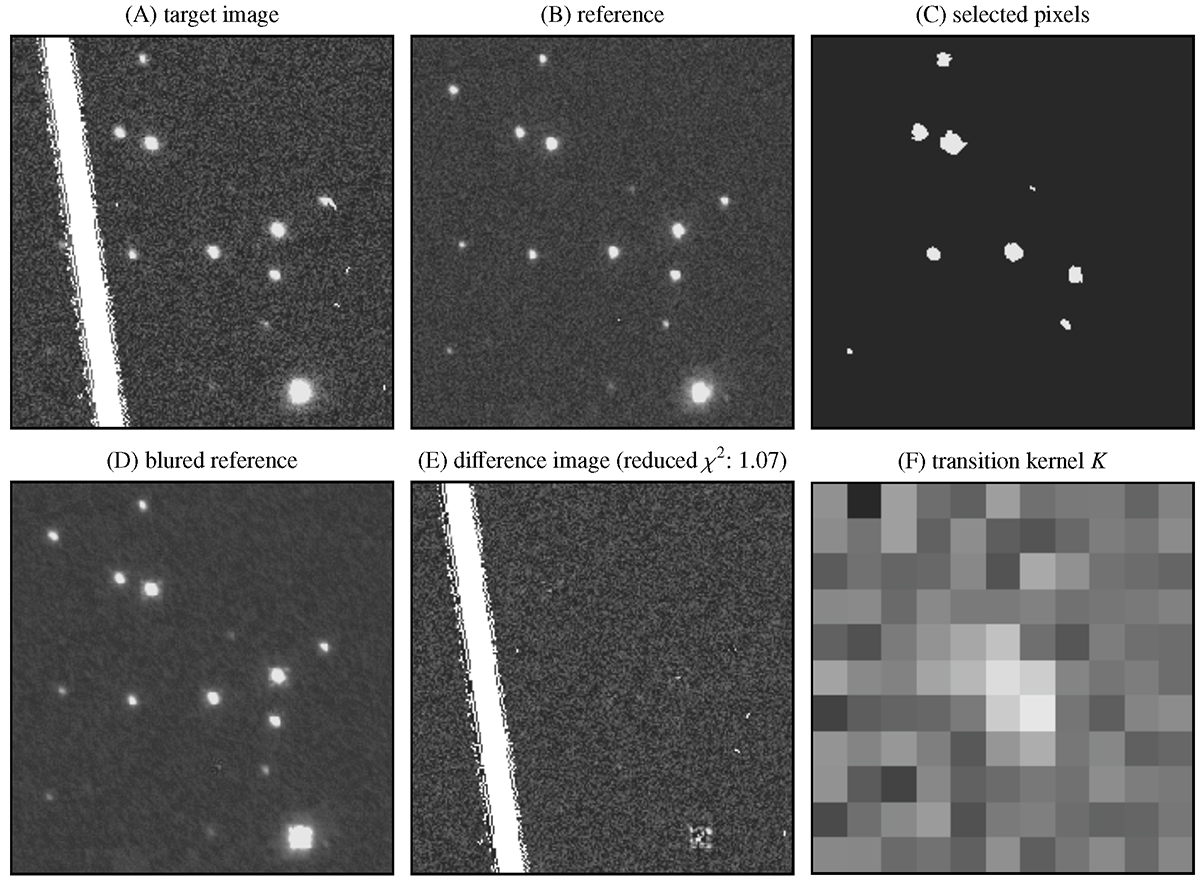
Illustration of the difference-imaging process using a 65″ stamp of Pan-STARRS data. Panel A shows an image obtained at any given epoch (I(x) in the text or target image), and panel B shows the best-seeing image of the time series, i.e. the reference image. Panel C shows the pixels that are used in the least-squares procedure. Saturated pixels are not considered. The blurred reference image is show in panel D, and panel E shows the residuals after the blurred reference is subtracted from the target image. The kernel used to blur the reference image is shown in panel F. In the present case, it is simply a low-pass filter coupled to a small translation accounting for the shift between the target and reference images.
Current usage metrics show cumulative count of Article Views (full-text article views including HTML views, PDF and ePub downloads, according to the available data) and Abstracts Views on Vision4Press platform.
Data correspond to usage on the plateform after 2015. The current usage metrics is available 48-96 hours after online publication and is updated daily on week days.
Initial download of the metrics may take a while.