Fig. 6.
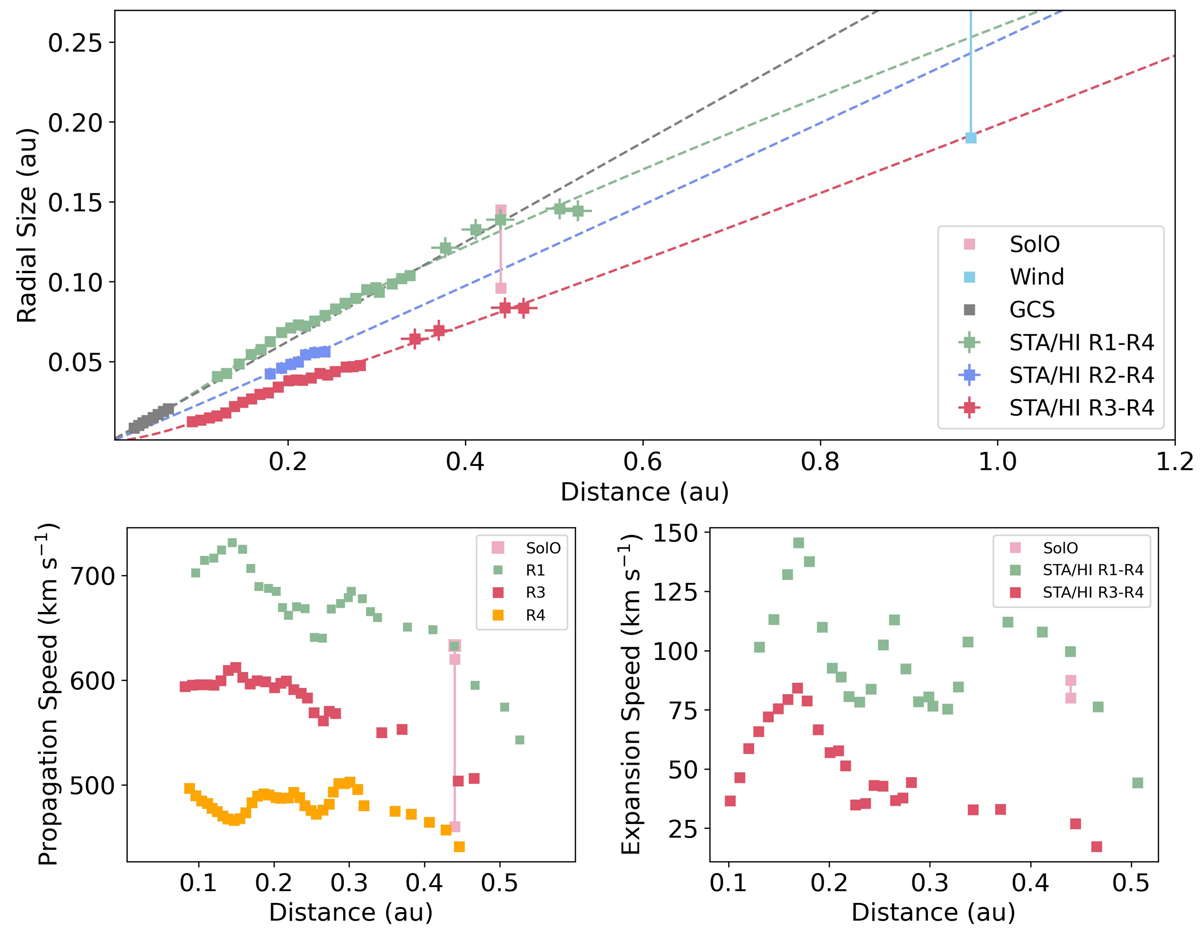
Download original image
Comparison of CME radial size, propagation speed, and expansion speed measured remotely and in situ. Top: Evolution of radial sizes of different CME substructures along with the heliocentric distances of the CME substructure fronts estimated using the GCS model and in STA HIs associated with the in situ estimates at SolO in pink (the whole CME and magnetic ejecta) and Wind in light blue (only the shorter ejecta size is shown). The dashed lines indicate the (two-band) power-law fits of the data points in remote observations. Bottom: Propagation and expansion speeds of different substructures of CME obtained in HI images and at SolO.
Current usage metrics show cumulative count of Article Views (full-text article views including HTML views, PDF and ePub downloads, according to the available data) and Abstracts Views on Vision4Press platform.
Data correspond to usage on the plateform after 2015. The current usage metrics is available 48-96 hours after online publication and is updated daily on week days.
Initial download of the metrics may take a while.