Fig. 4.
Download original image
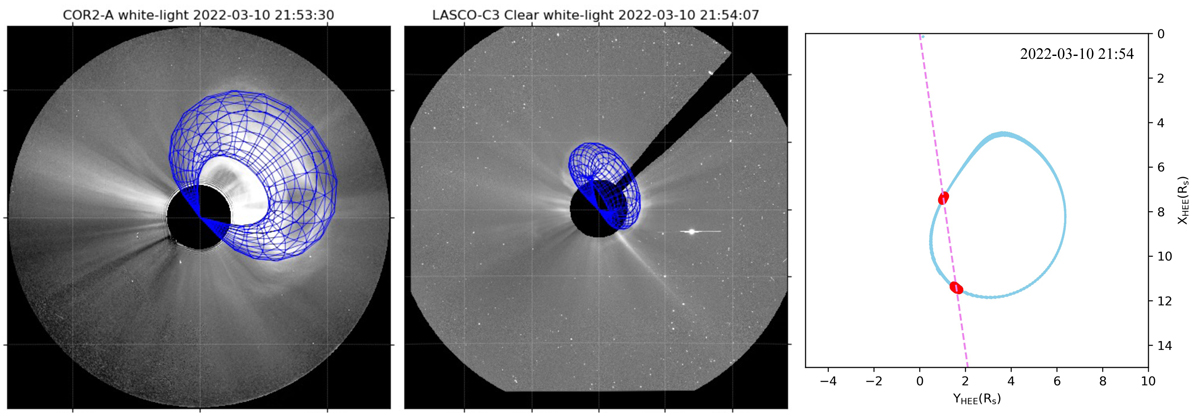
3D reconstruction of 2022 March 10 CME. Left and middle panels: Reconstructed flux rope structure from the GCS model (blue) overlaid on the STA COR2 and SOHO LASCO-C3 running-difference images at around 21:54 UT. Right panel: CME structure from GCS model intersected in ecliptic plane. The pink line corresponds to the Sun-SolO line, and the two red dots mark the locations of the intersected points between the CME and the Sun-SolO line.
Current usage metrics show cumulative count of Article Views (full-text article views including HTML views, PDF and ePub downloads, according to the available data) and Abstracts Views on Vision4Press platform.
Data correspond to usage on the plateform after 2015. The current usage metrics is available 48-96 hours after online publication and is updated daily on week days.
Initial download of the metrics may take a while.