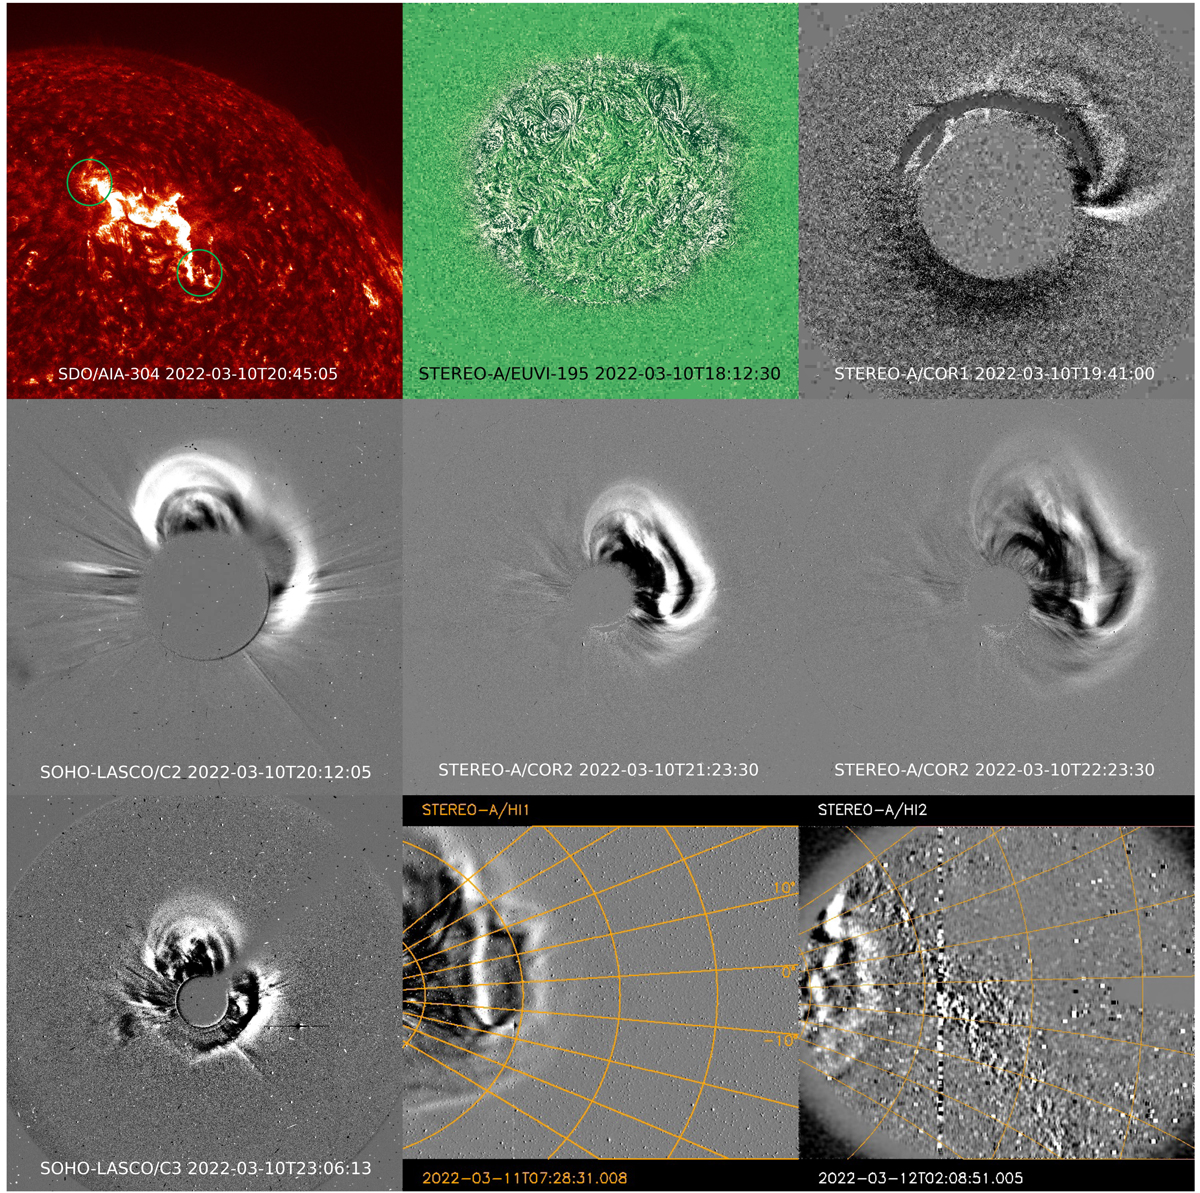
Fig. 2.
Download original image
2022 March 10 CME observations from SDO, STA, and LASCO. From left to right and from top to bottom: SDO AIA at a wavelength of 304 Å, STA EUVI at a wavelength of 195 Å, STA COR1, SOHO LASCO-C2, STA COR2 at two time-steps: SOHO LASCO-C3, STA HI1 and STA HI2. These images were processed using the running-difference technique, except the first AIA image. The green circles in the top left panel indicate the locations of the CME feet. The orange concentric circles show the elongation angles, and the radial lines show the position angles in the STA HI1 and STA HI2 images.
Current usage metrics show cumulative count of Article Views (full-text article views including HTML views, PDF and ePub downloads, according to the available data) and Abstracts Views on Vision4Press platform.
Data correspond to usage on the plateform after 2015. The current usage metrics is available 48-96 hours after online publication and is updated daily on week days.
Initial download of the metrics may take a while.