Fig. 4.
Download original image
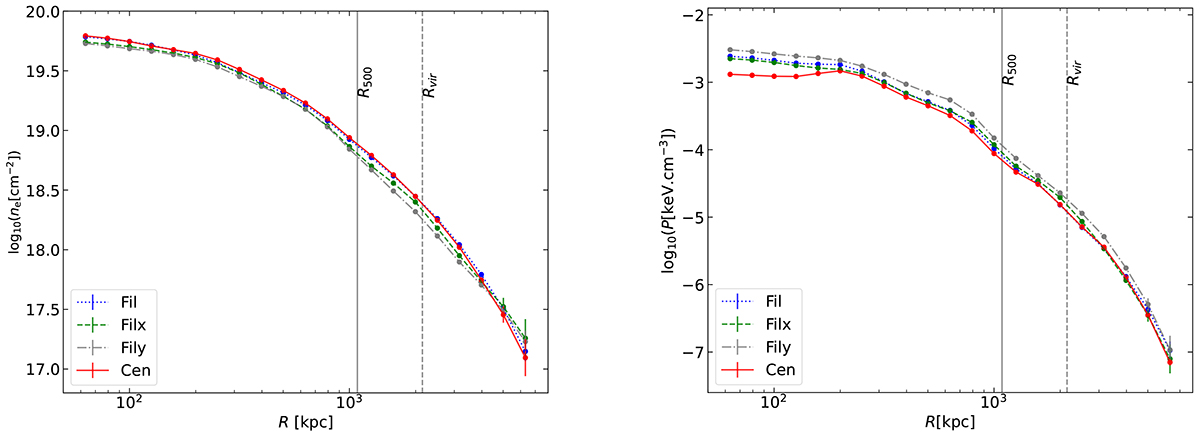
2D radial electron density (left) and pressure (right) profiles. The blue dotted profile is the Fil projection, the green dashed and grey dash-dotted profiles are the Filx and Fily projections, respectively. The solid red profile is the Cen projection. The vertical solid line is R500, the vertical dashed line is the virial radius. The electron density profiles intensity is proportional to the total matter in each direction. More mass along a given direction outside the cluster induces a lower mean pressure.
Current usage metrics show cumulative count of Article Views (full-text article views including HTML views, PDF and ePub downloads, according to the available data) and Abstracts Views on Vision4Press platform.
Data correspond to usage on the plateform after 2015. The current usage metrics is available 48-96 hours after online publication and is updated daily on week days.
Initial download of the metrics may take a while.