Open Access
Fig. B.1.
Download original image
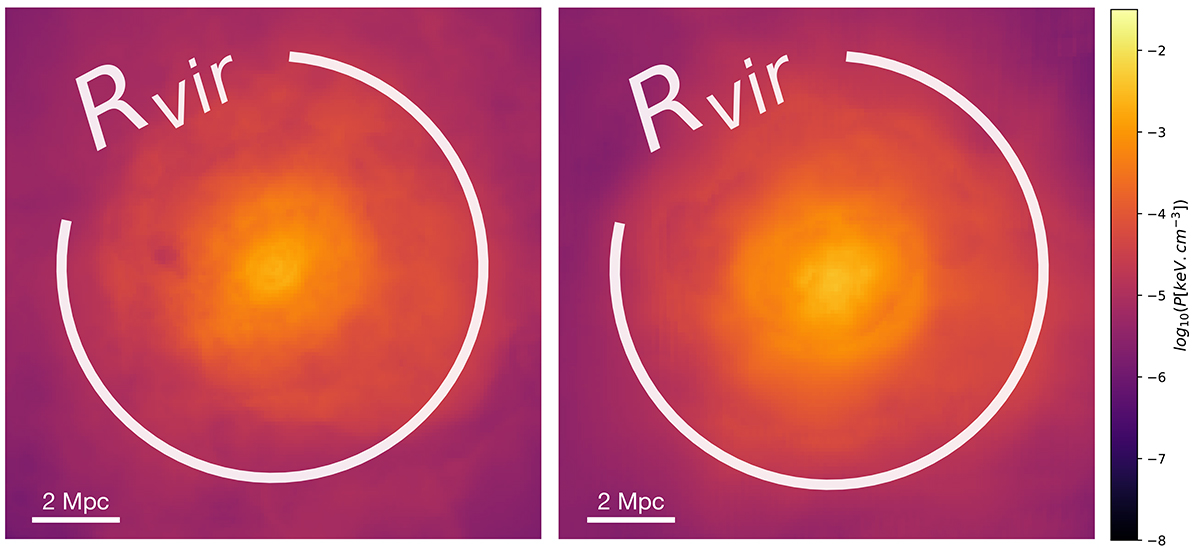
Pressure maps from Fil direction in high- (left) and low-resolution (right) simulations. The maps are ∼ 12 Mpc wide and centred on the Virgo cluster centre. The circle is the virial radius.
Current usage metrics show cumulative count of Article Views (full-text article views including HTML views, PDF and ePub downloads, according to the available data) and Abstracts Views on Vision4Press platform.
Data correspond to usage on the plateform after 2015. The current usage metrics is available 48-96 hours after online publication and is updated daily on week days.
Initial download of the metrics may take a while.