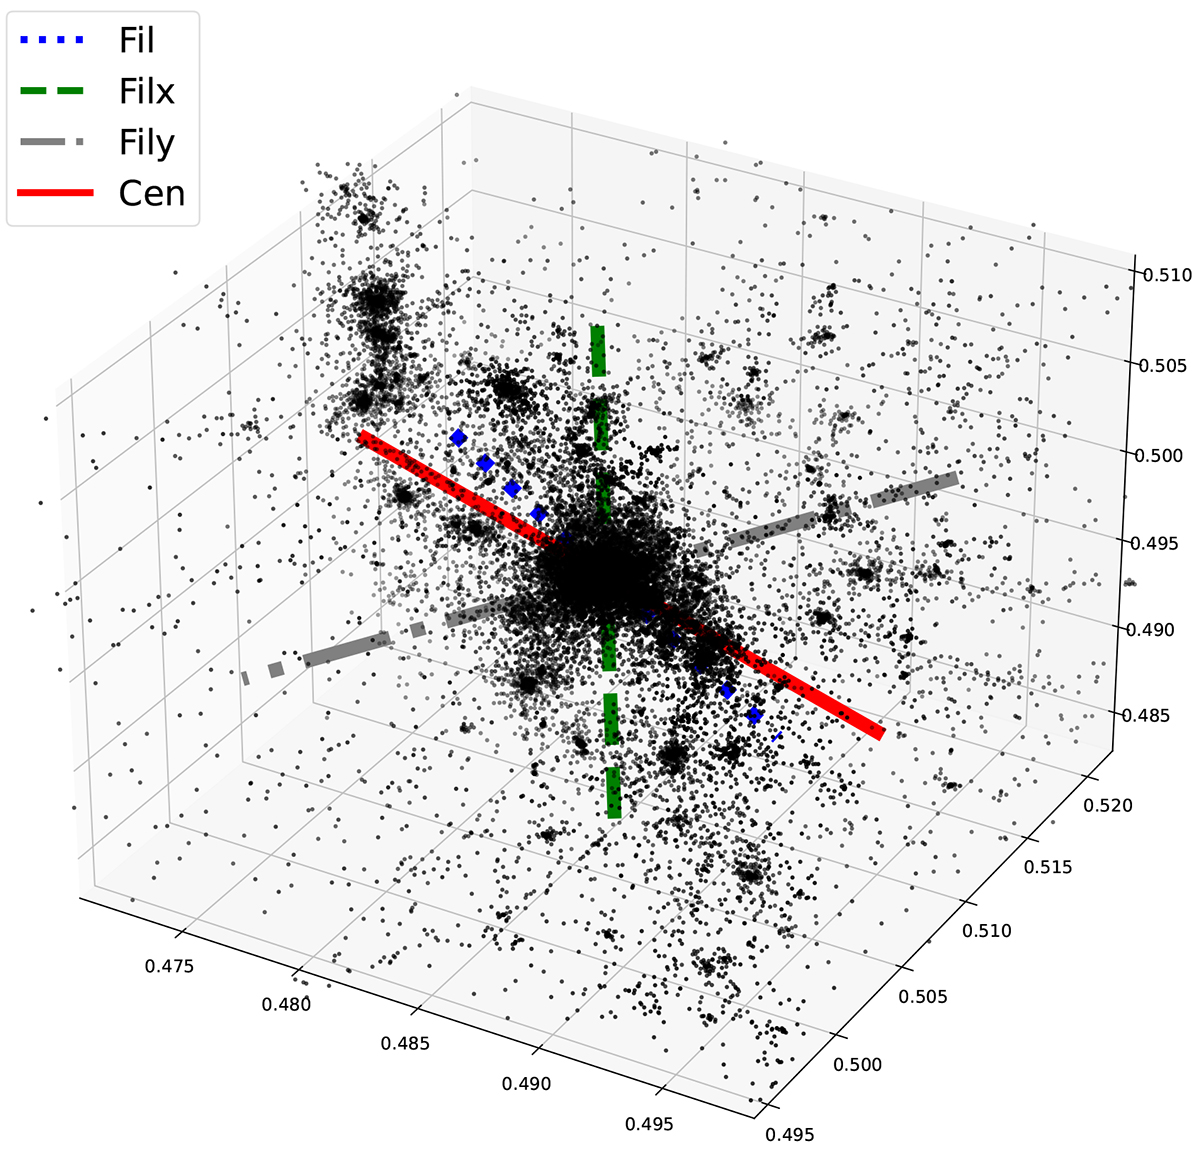
Fig. 1.
Download original image
DM box of simulated Virgo cluster. The coloured lines represent the axis of projection. The red solid line axis is for the projection from the centre of the box to Virgo (Cen), the blue dotted line shows the projection along the main filament (Fil), and the green dashed and grey dash-dotted lines show the projections perpendicular to the main filament, with a rotation around the x (Filx) and y (Fily) axis, respectively.
Current usage metrics show cumulative count of Article Views (full-text article views including HTML views, PDF and ePub downloads, according to the available data) and Abstracts Views on Vision4Press platform.
Data correspond to usage on the plateform after 2015. The current usage metrics is available 48-96 hours after online publication and is updated daily on week days.
Initial download of the metrics may take a while.