Fig. 3.
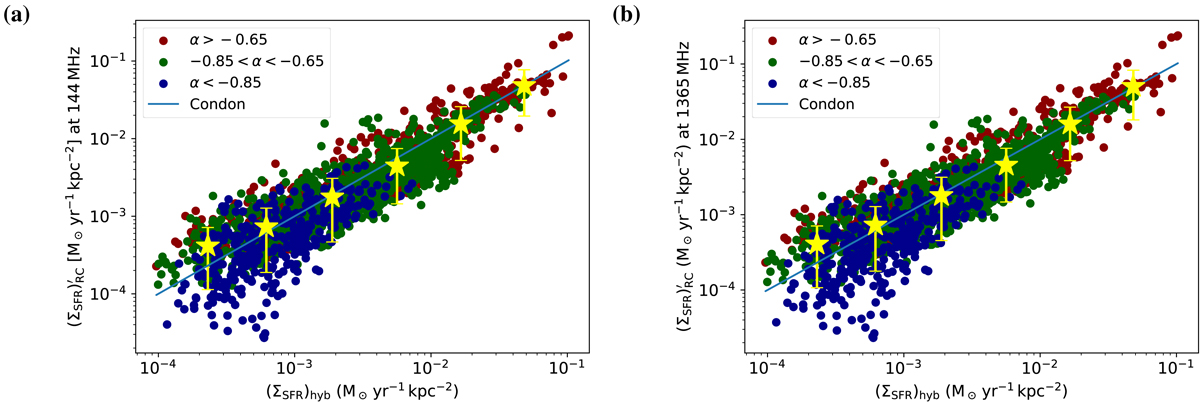
Download original image
Combined radio-SFR plots corrected for the CRE calorimetric efficiency at 144 (panel a) and 1365 MHz (panel b). We show the radio ΣSFR, which we have corrected with the parametrisation of the calorimetric efficiency as function of the radio spectral index, as function of the hybrid ΣSFR. The 1:1 Condon’s relation is shown as blue line. Data points are coloured according to the 144–1365 MHz radio spectral index. Yellow stars show mean values. The best-fitting power-law relations are not shown as they are virtually in agreement with Condon’s relation (see Table 2 for details).
Current usage metrics show cumulative count of Article Views (full-text article views including HTML views, PDF and ePub downloads, according to the available data) and Abstracts Views on Vision4Press platform.
Data correspond to usage on the plateform after 2015. The current usage metrics is available 48-96 hours after online publication and is updated daily on week days.
Initial download of the metrics may take a while.