Fig. 2.
Download original image
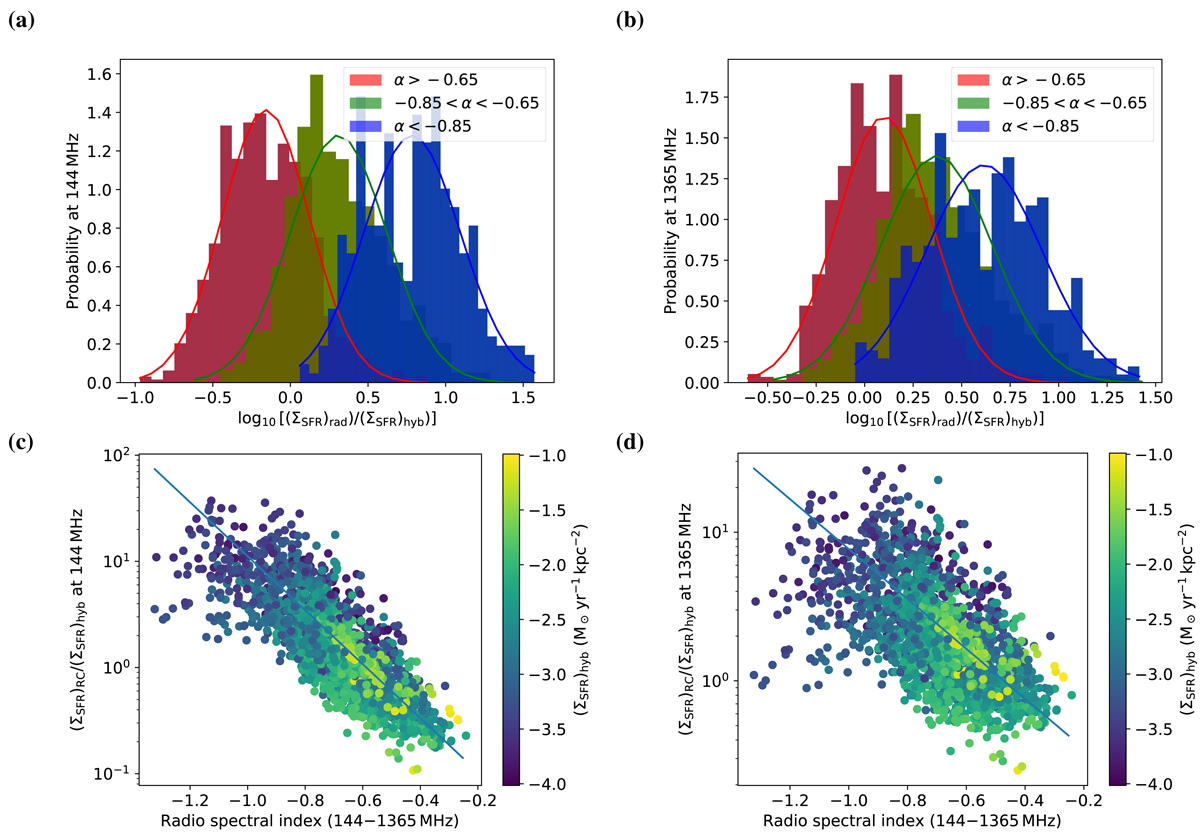
Ratio of radio to hybrid ΣSFR. Top panels show histograms of the ratio separately for the three radio spectral index bins at 144 MHz (panel a) and 1365 MHz (panel b). Data points representing young CREs are in red, middle-aged CREs are in green, and old CREs are in blue, respectively. Best-fitting Gaussian distributions are shown as solid lines. Bottom panels show the ratio as function of the radio spectral index between 144 and 1365 MHz for 144 MHz (panel c) and 1365 MHz (panel d). Best-fitting exponential functions (Eq. (11)) shown as solid lines.
Current usage metrics show cumulative count of Article Views (full-text article views including HTML views, PDF and ePub downloads, according to the available data) and Abstracts Views on Vision4Press platform.
Data correspond to usage on the plateform after 2015. The current usage metrics is available 48-96 hours after online publication and is updated daily on week days.
Initial download of the metrics may take a while.