Fig. 1.
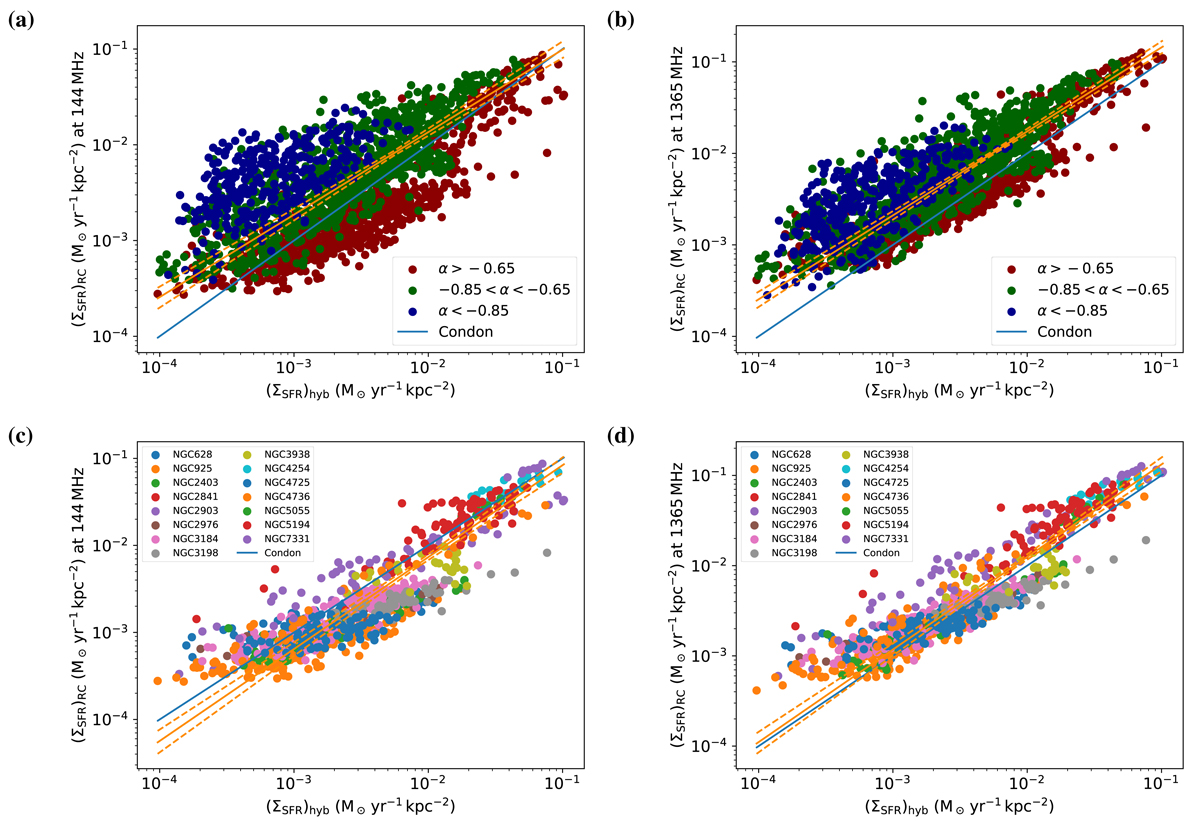
Download original image
Combined radio-SFR plots. Panels a and b show the radio ΣSFR at 144 and 1365 MHz, respectively, as function of the hybrid ΣSFR. Data points are colour-coded, so that young CREs are shown in red, middle-aged CREs are shown in green, and old CREs are shown in blue. Panels c and d show the relation only for young CREs, where the various galaxies are now colour-coded. Solid lines show in blue the 1:1 Condon’s relation and in orange the best-fitting power-law relations with 3σ confidence intervals indicated by dashed lines. Details of the best-fitting relations can found in Table 2.
Current usage metrics show cumulative count of Article Views (full-text article views including HTML views, PDF and ePub downloads, according to the available data) and Abstracts Views on Vision4Press platform.
Data correspond to usage on the plateform after 2015. The current usage metrics is available 48-96 hours after online publication and is updated daily on week days.
Initial download of the metrics may take a while.