Fig. 4.

Download original image
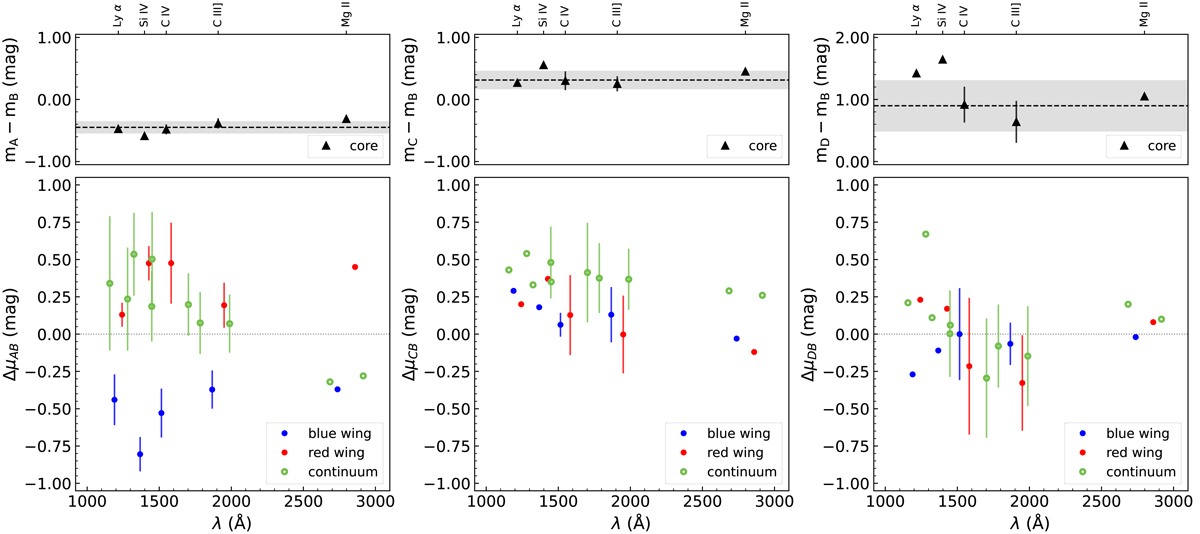
Average magnitude differences in the line cores (upper panels), and differential microlensing estimates in the continuum and emission line wings (lower panels) for the image pairs A–B (left), C–B (middle), and D–B (right). Calculations are detailed in Sects. 3.1–3.3, and the corresponding results are presented in Tables 2–5. Black triangles show the magnitude differences in the line cores, while the black horizontal lines represent the average magnitude differences. The gray-shaded intervals denote the standard deviation. Notably, no discernible wavelength trend is observed in the magnitude differences of line cores among all image pairs. The green-colored data points represent the differential microlensing estimates in the continuum at various wavelengths for the A–B, C–B, and D–B image pairs, respectively. One intriguing observation is the substantial offset of around 0.9 mag in the A–B microlensing measurements between the blue and red wings (shown as blue- and red-colored data points, respectively) of multiple emission lines. This offset suggests that image A experiences magnification in the blue wing and de-magnification in the red wing.
Current usage metrics show cumulative count of Article Views (full-text article views including HTML views, PDF and ePub downloads, according to the available data) and Abstracts Views on Vision4Press platform.
Data correspond to usage on the plateform after 2015. The current usage metrics is available 48-96 hours after online publication and is updated daily on week days.
Initial download of the metrics may take a while.


