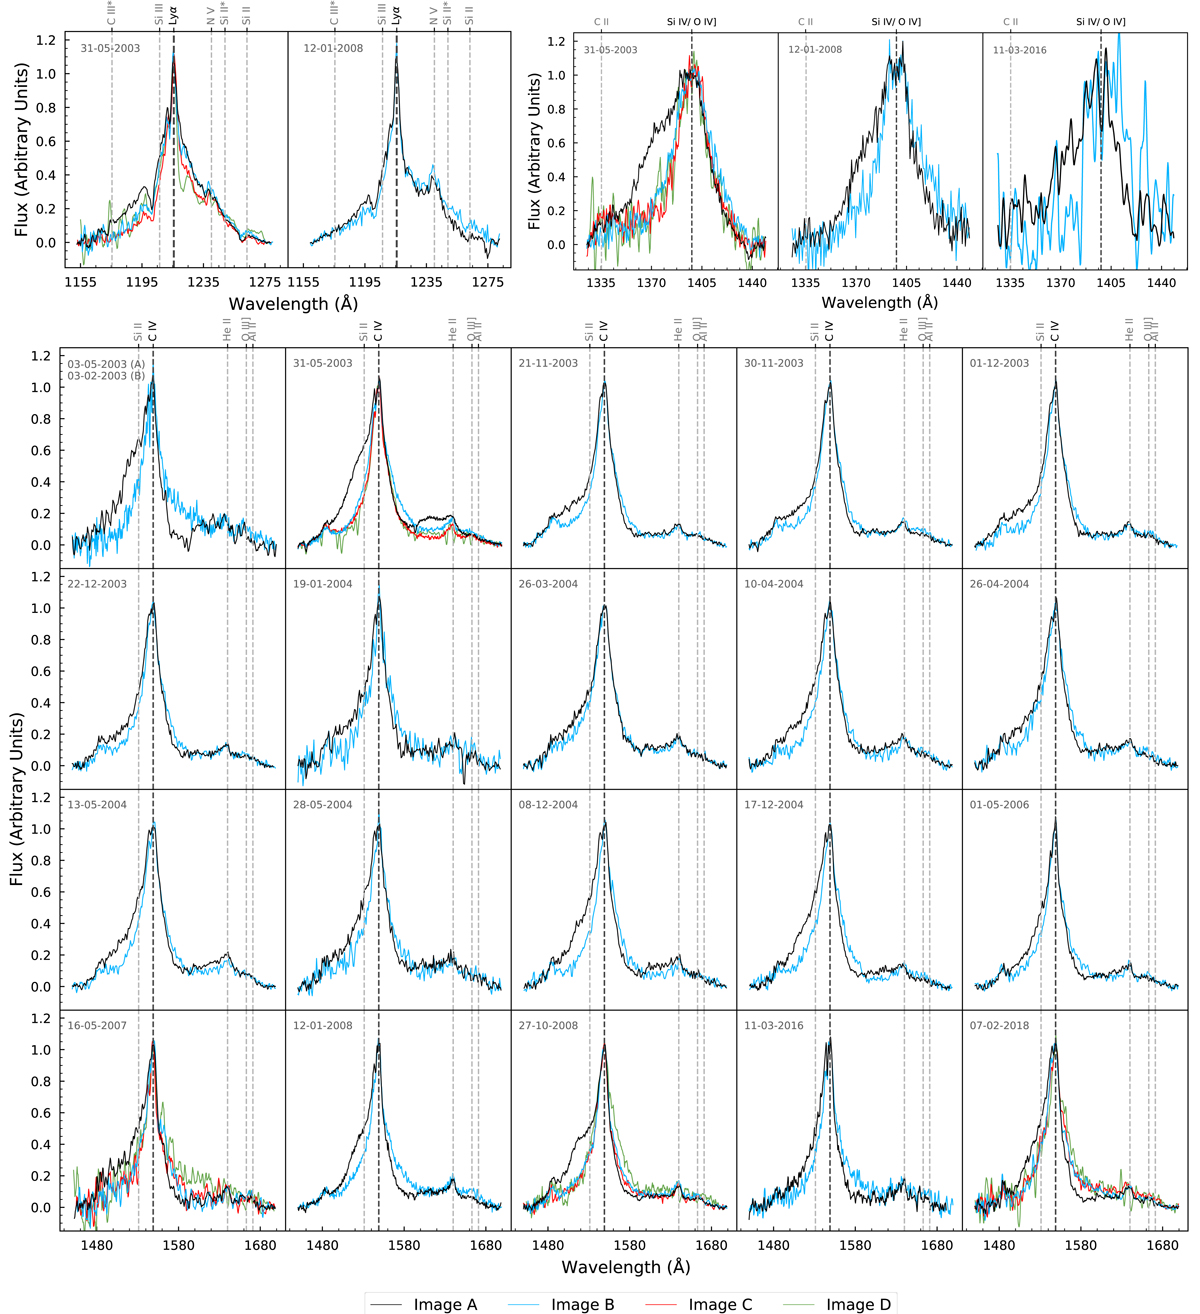
Fig. 1.

Download original image
Emission line profiles of images A (black), B (blue), C (red), and D (green) at different observational epochs in the rest-frame after the continuum has been subtracted and the line core has been matched (see text). The Lyα line is shown in the top left panel at two different epochs. The top right panel shows the Si IV line in three observational epochs, while the bottom panel displays 20 observational epochs for the C IV line. Observations reveal significant deformations and variability in the blue wings of all emission lines, with image A showing the most pronounced changes. In addition, image A appears to be demagnified in the red wings. The y-axis represents the flux in arbitrary units.
Current usage metrics show cumulative count of Article Views (full-text article views including HTML views, PDF and ePub downloads, according to the available data) and Abstracts Views on Vision4Press platform.
Data correspond to usage on the plateform after 2015. The current usage metrics is available 48-96 hours after online publication and is updated daily on week days.
Initial download of the metrics may take a while.


