Fig. B.1.
Download original image
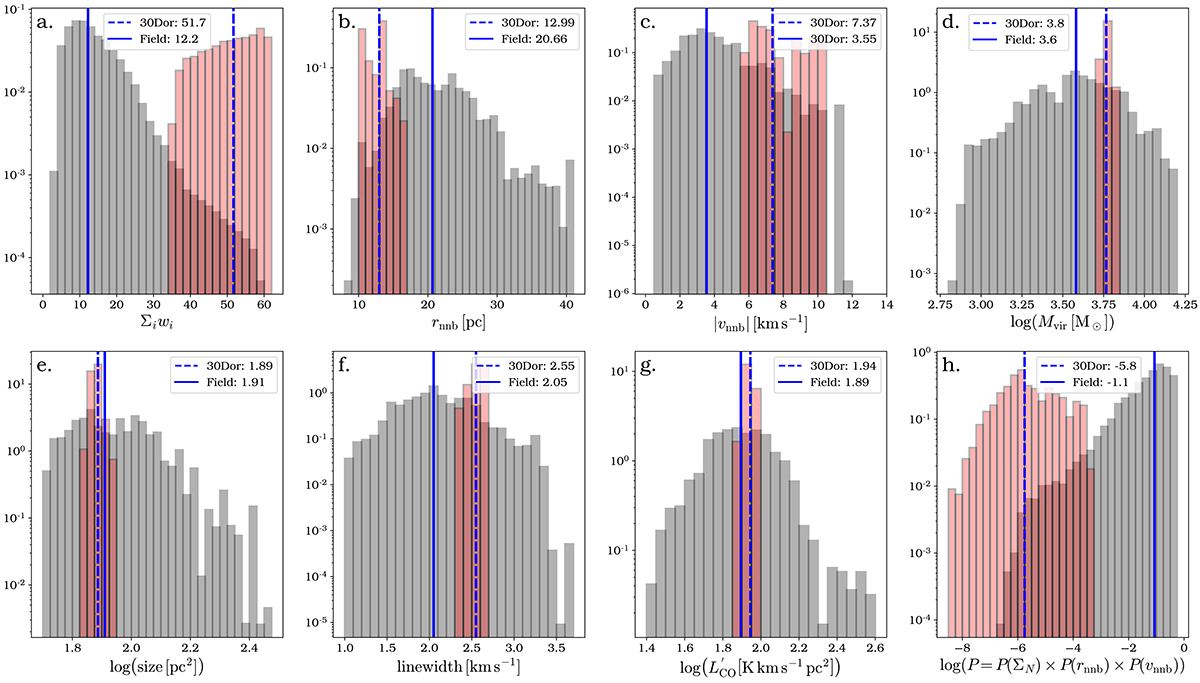
Distributions of the molecular clouds’ properties (see Sect. 3.3). The panels show: the distributions of a sum of the window function weights, Σiwi, which we used as a proxy for the weighted areal number density (a); the separation between the nearest neighbour clouds, rnnb (b); the absolute value of the nearest neighbour velocity, |vnnb| (c); the virial mass, Mvir (d); size (e); linewidth (f); CO line luminosity, ![]() (g); and the probability (h; see panel d of Fig. 4). The red and grey histograms show the distributions of the cloud properties for the data points inside and outside the 30Dor aperture, respectively. The 30Dor aperture was centred on R136, assuming a radius of 100 pc. The vertical blue lines show the medians of the distributions: 30Dor (dashed) and field (i.e. outside 30Dor; solid). The y axes are shown using a logarithmic scale. We note that the Σiwi, rnnb, |vnnb| distributions show a clear difference between the 30Dor region and the rest of the observed field as opposed to all the other properties analysed.
(g); and the probability (h; see panel d of Fig. 4). The red and grey histograms show the distributions of the cloud properties for the data points inside and outside the 30Dor aperture, respectively. The 30Dor aperture was centred on R136, assuming a radius of 100 pc. The vertical blue lines show the medians of the distributions: 30Dor (dashed) and field (i.e. outside 30Dor; solid). The y axes are shown using a logarithmic scale. We note that the Σiwi, rnnb, |vnnb| distributions show a clear difference between the 30Dor region and the rest of the observed field as opposed to all the other properties analysed.
Current usage metrics show cumulative count of Article Views (full-text article views including HTML views, PDF and ePub downloads, according to the available data) and Abstracts Views on Vision4Press platform.
Data correspond to usage on the plateform after 2015. The current usage metrics is available 48-96 hours after online publication and is updated daily on week days.
Initial download of the metrics may take a while.