Fig. 5.
Download original image
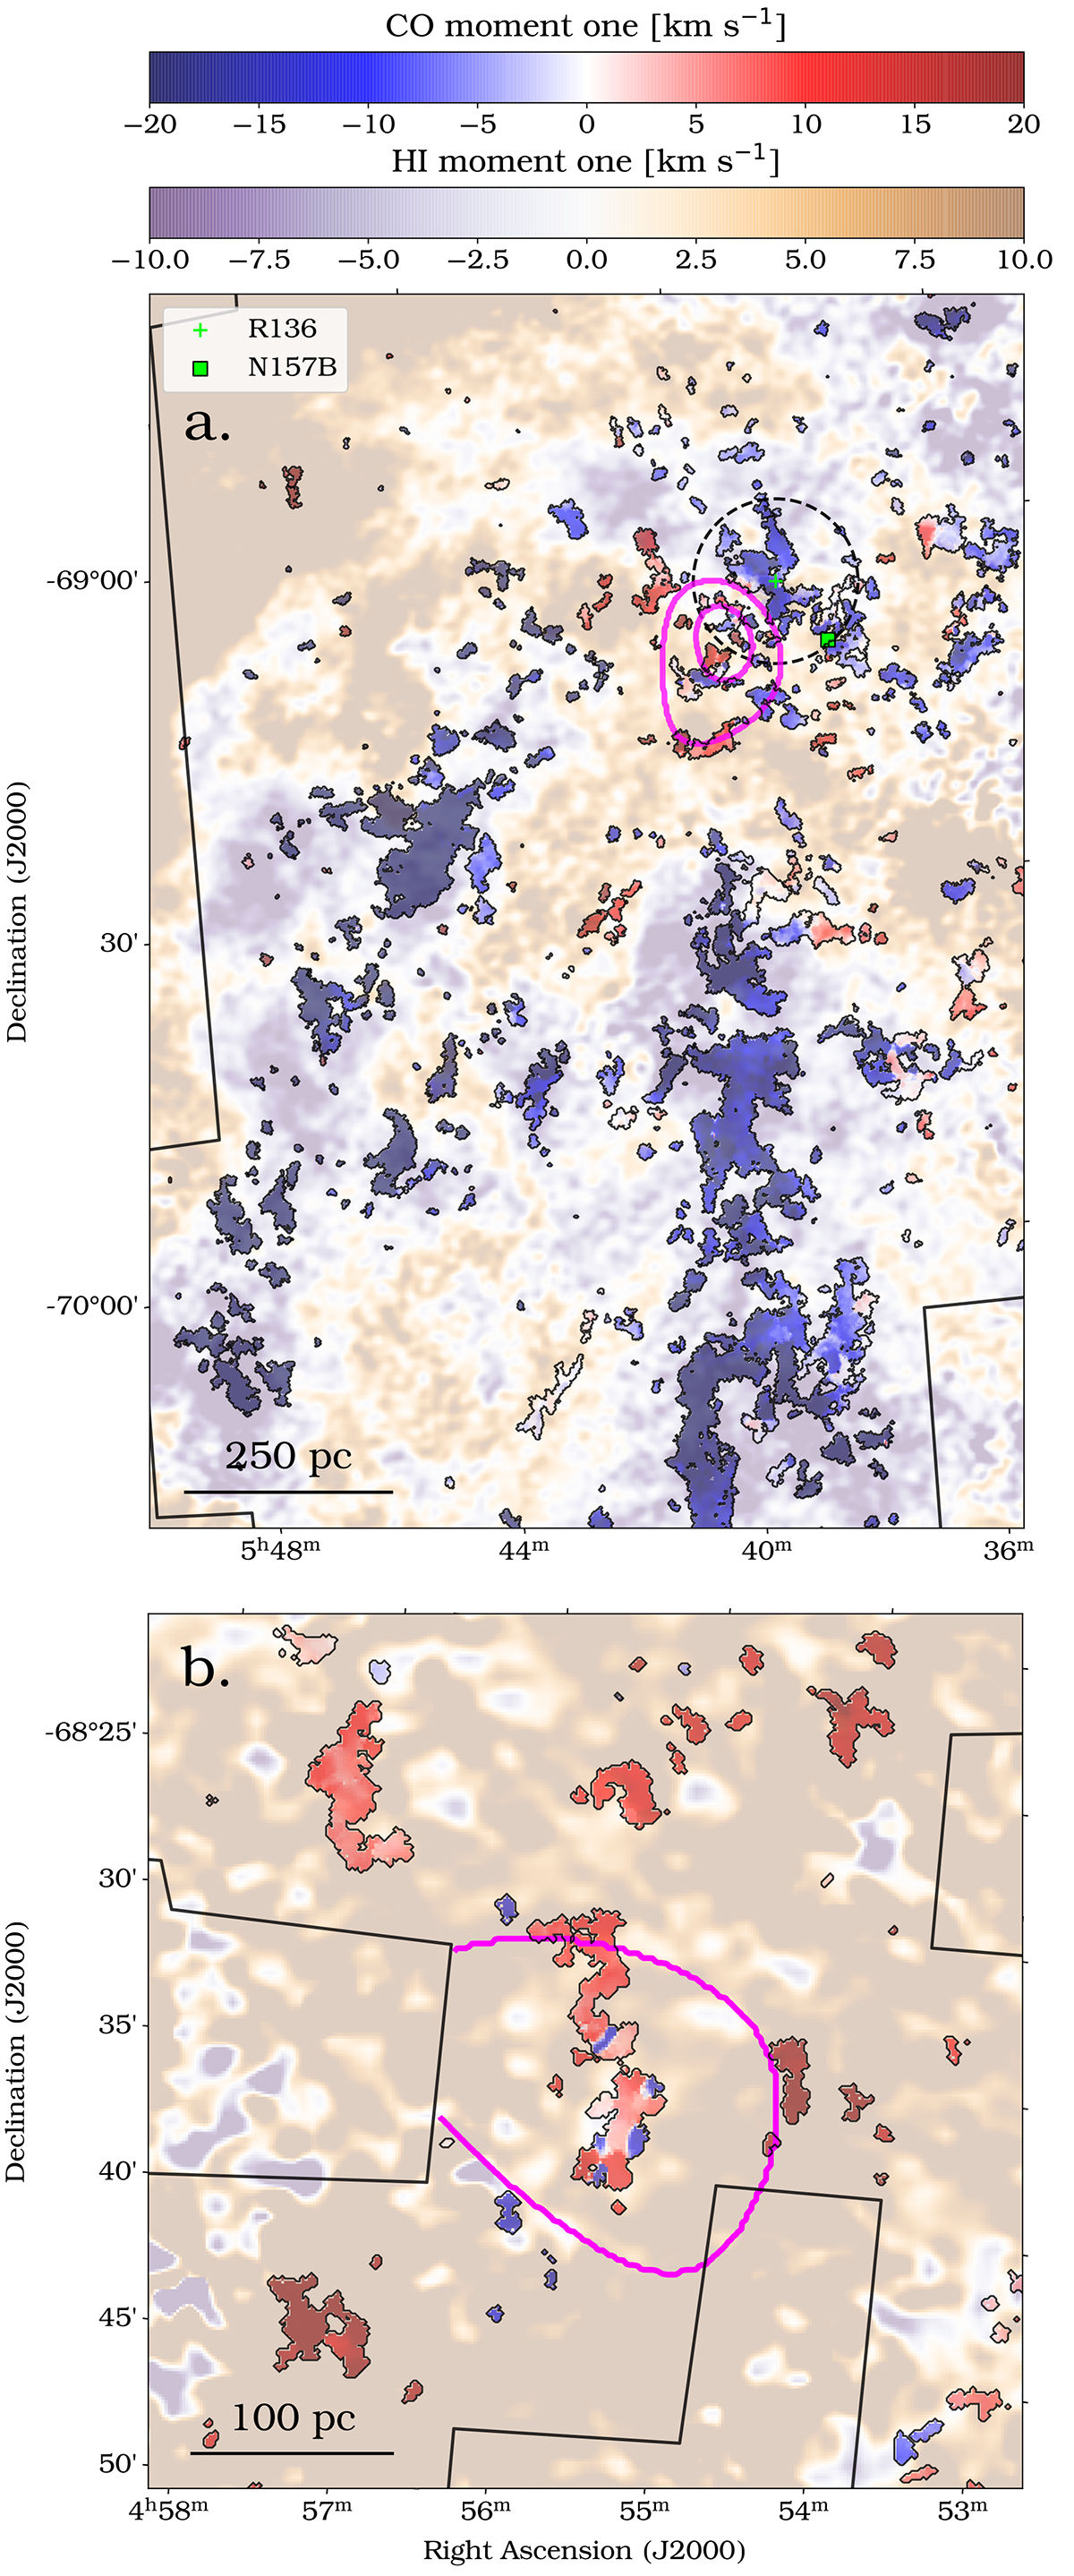
CO and HI moment-one maps with a modelled rotation of the LMC disc subtracted (see Sect. 3.1.1 for the used rotation model and its parameters). The panels show zooms into (a) the molecular ridge and CO Arm of the LMC and (b) the low-probability region marked by the yellow box in panel d of Fig. 4. The pink contours show the high |vnnb| regions (see panel c of Fig. 4) corresponding to (a) 9 km s−1 (outer) and 10 km s−1 (inner) and (b) 10 km s−1. The solid black lines outline the analysed survey coverage.
Current usage metrics show cumulative count of Article Views (full-text article views including HTML views, PDF and ePub downloads, according to the available data) and Abstracts Views on Vision4Press platform.
Data correspond to usage on the plateform after 2015. The current usage metrics is available 48-96 hours after online publication and is updated daily on week days.
Initial download of the metrics may take a while.