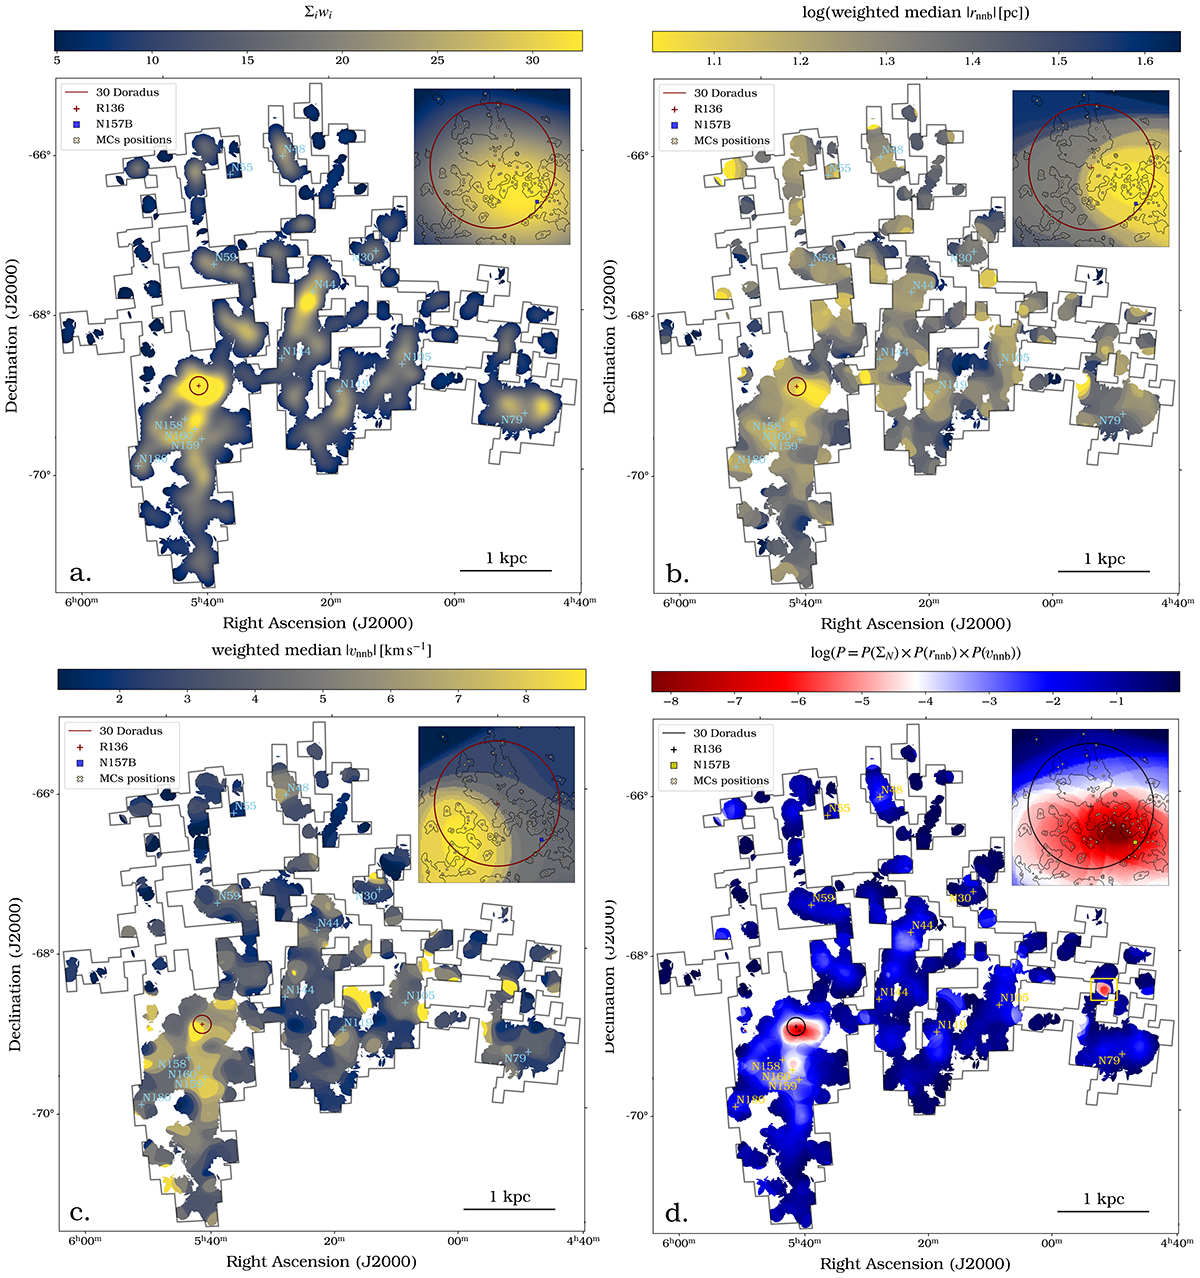
Fig. 4.
Download original image
Maps of the clouds properties (see Sect. 3.3). The panels show a sum of the window function weights, Σiwi (a), weighted medians for the nearest neighbour separation, rnnb (b), and the absolute value of the nearest neighbour velocity, vnnb (c), and the probability of finding clouds with properties more extreme than those in a given point (d). The corresponding zooms into 30Dor are shown in the upper right corners of each individual map. The majority of low-probability “spots” in panel d are visually associated with known active star formation regions in the LMC (N158, N159, etc.), except for one spot marked by the yellow box.
Current usage metrics show cumulative count of Article Views (full-text article views including HTML views, PDF and ePub downloads, according to the available data) and Abstracts Views on Vision4Press platform.
Data correspond to usage on the plateform after 2015. The current usage metrics is available 48-96 hours after online publication and is updated daily on week days.
Initial download of the metrics may take a while.