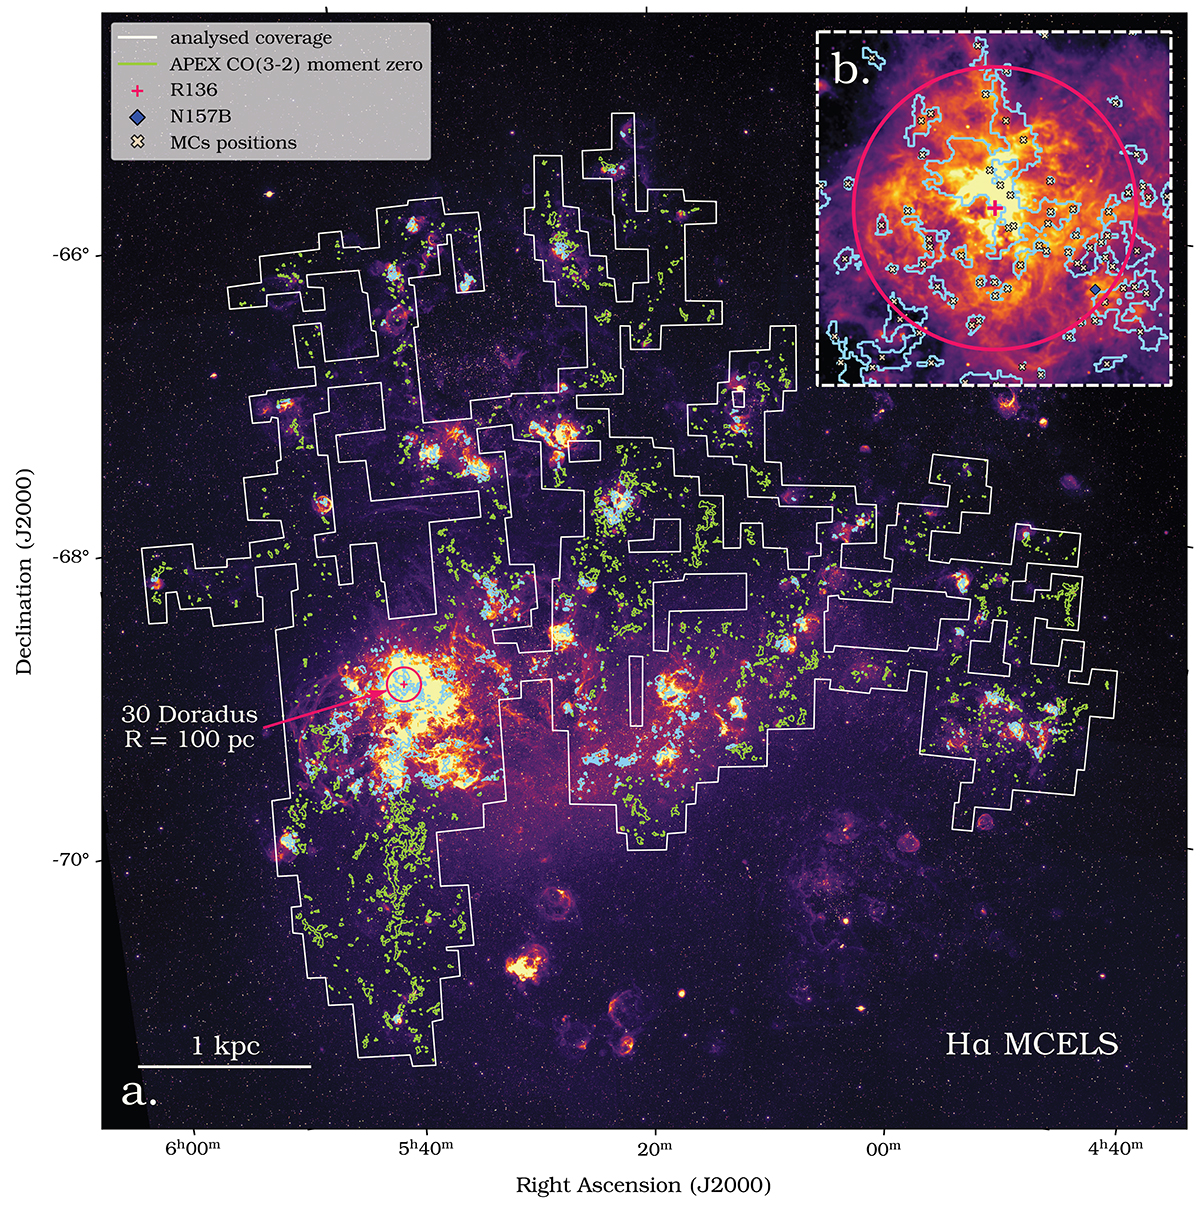
Fig. 1.
Download original image
Large Magellanic Cloud. The underlying image is the Hα MCELS map (Smith & MCELS Team 1998). Panel a shows the coverage of the ongoing APEX CO line Legacy Survey (white line) analysed in this work and (in yellow-green) the contours of the CO moment-zero map, with the level corresponding to the signal-to-noise threshold of S/N = 2 in the masked CO data. The moment-zero contours overlapping with Hα-bright regions (see Sect. 3) are highlighted in blue. The 30Dor region is marked by the pink circle with a radius of 100 pc that is centred on the position of R136. Panel b is a zoom into the 30Dor region. The positions of the molecular clouds are shown by X marks.
Current usage metrics show cumulative count of Article Views (full-text article views including HTML views, PDF and ePub downloads, according to the available data) and Abstracts Views on Vision4Press platform.
Data correspond to usage on the plateform after 2015. The current usage metrics is available 48-96 hours after online publication and is updated daily on week days.
Initial download of the metrics may take a while.