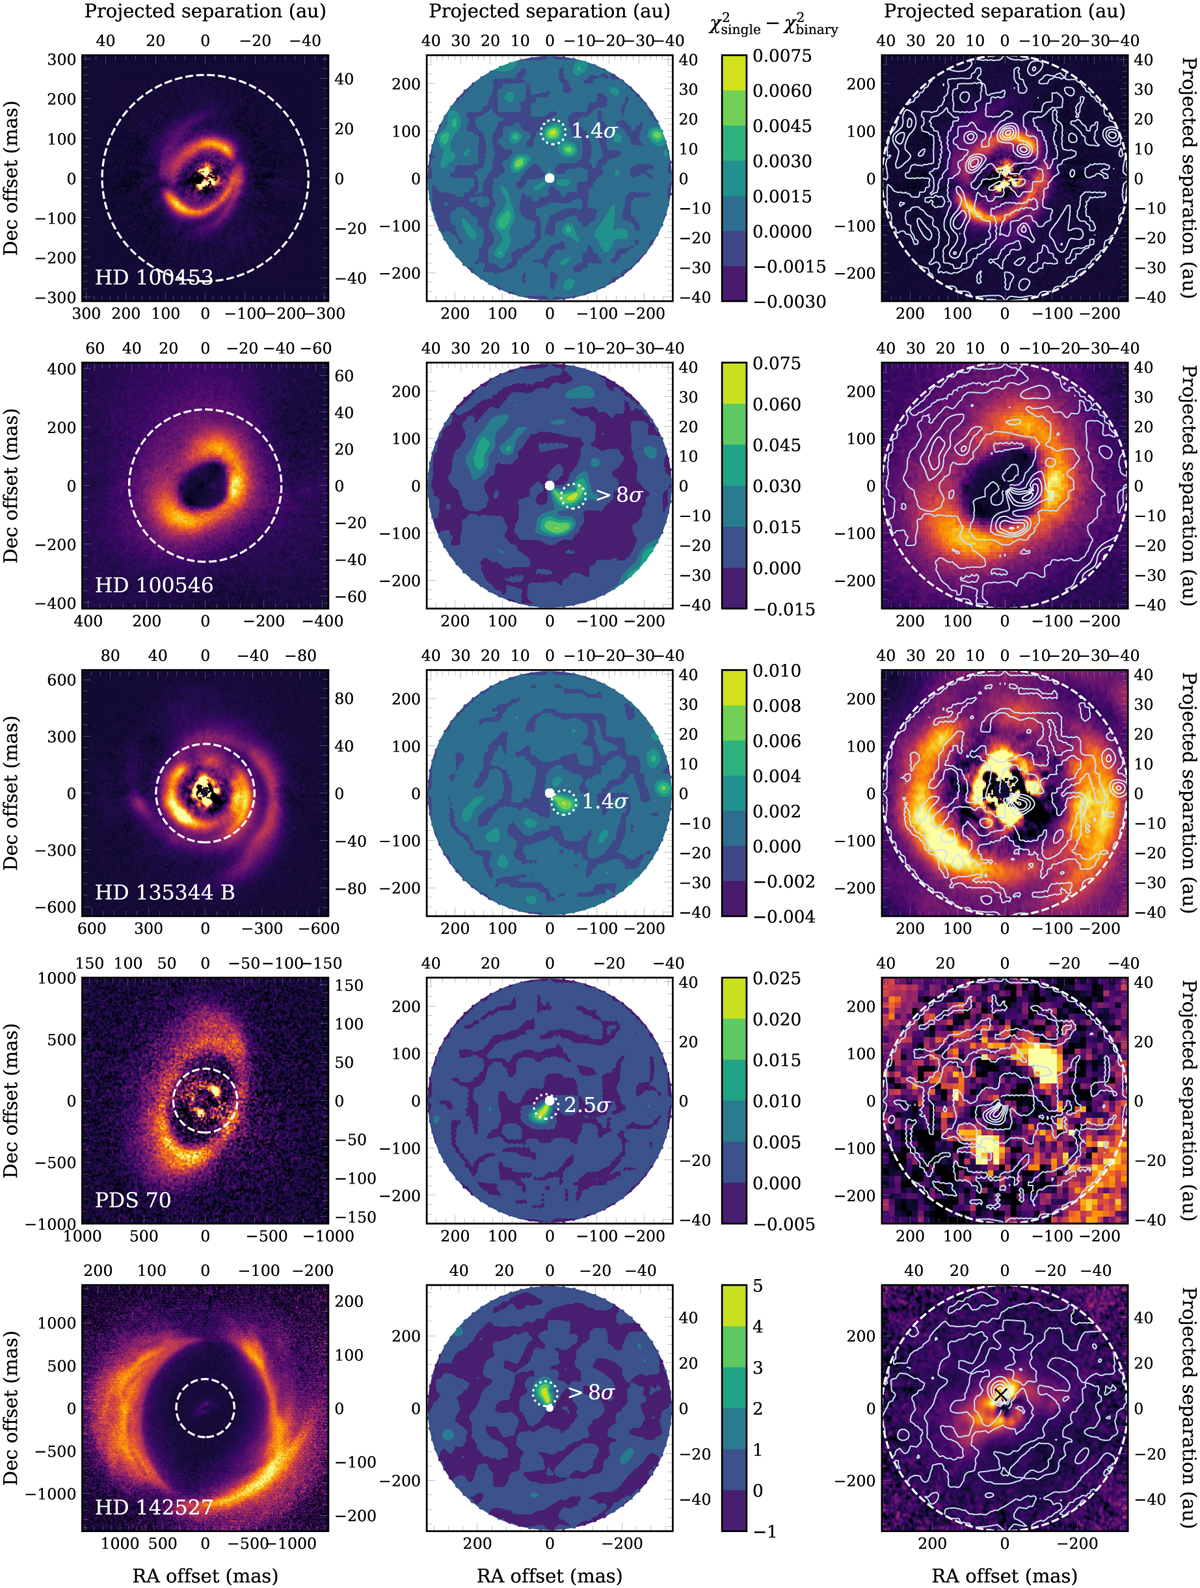
Fig. 3
Download original image
Detection maps for companions. The left column shows full images of the disks, the central column the χ2 maps, and the right column a zoom to the field of view of the AMI observations with contours showing the χ2 levels. The dashed circles correspond to the field of view. The χ2 maps are calculated as the difference in the goodness-of-fit statistic between a model without companion and the minimum χ2 of a model with a companion. The position with the highest confidence level is encircled in the maps of the central column. It is important to note that the dynamical range of the colorbar is different between targets. See main text in Sect. 3.1 for details on the interpretation of the contours. The black cross in the bottom right panel is placed at the best-fit position of HD 142527 B. The disk images are in polarized scattered light, all obtained in the optical with ZIMPOL, except PDS 70 in the near-infrared with IRDIS. From top to bottom the images have been adopted from: Benisty et al. (2017), Garufi et al. (2016), Stolker et al. (2016), van Holstein et al. (2021), Avenhaus et al. (2017).
Current usage metrics show cumulative count of Article Views (full-text article views including HTML views, PDF and ePub downloads, according to the available data) and Abstracts Views on Vision4Press platform.
Data correspond to usage on the plateform after 2015. The current usage metrics is available 48-96 hours after online publication and is updated daily on week days.
Initial download of the metrics may take a while.