Fig. 3.
Download original image
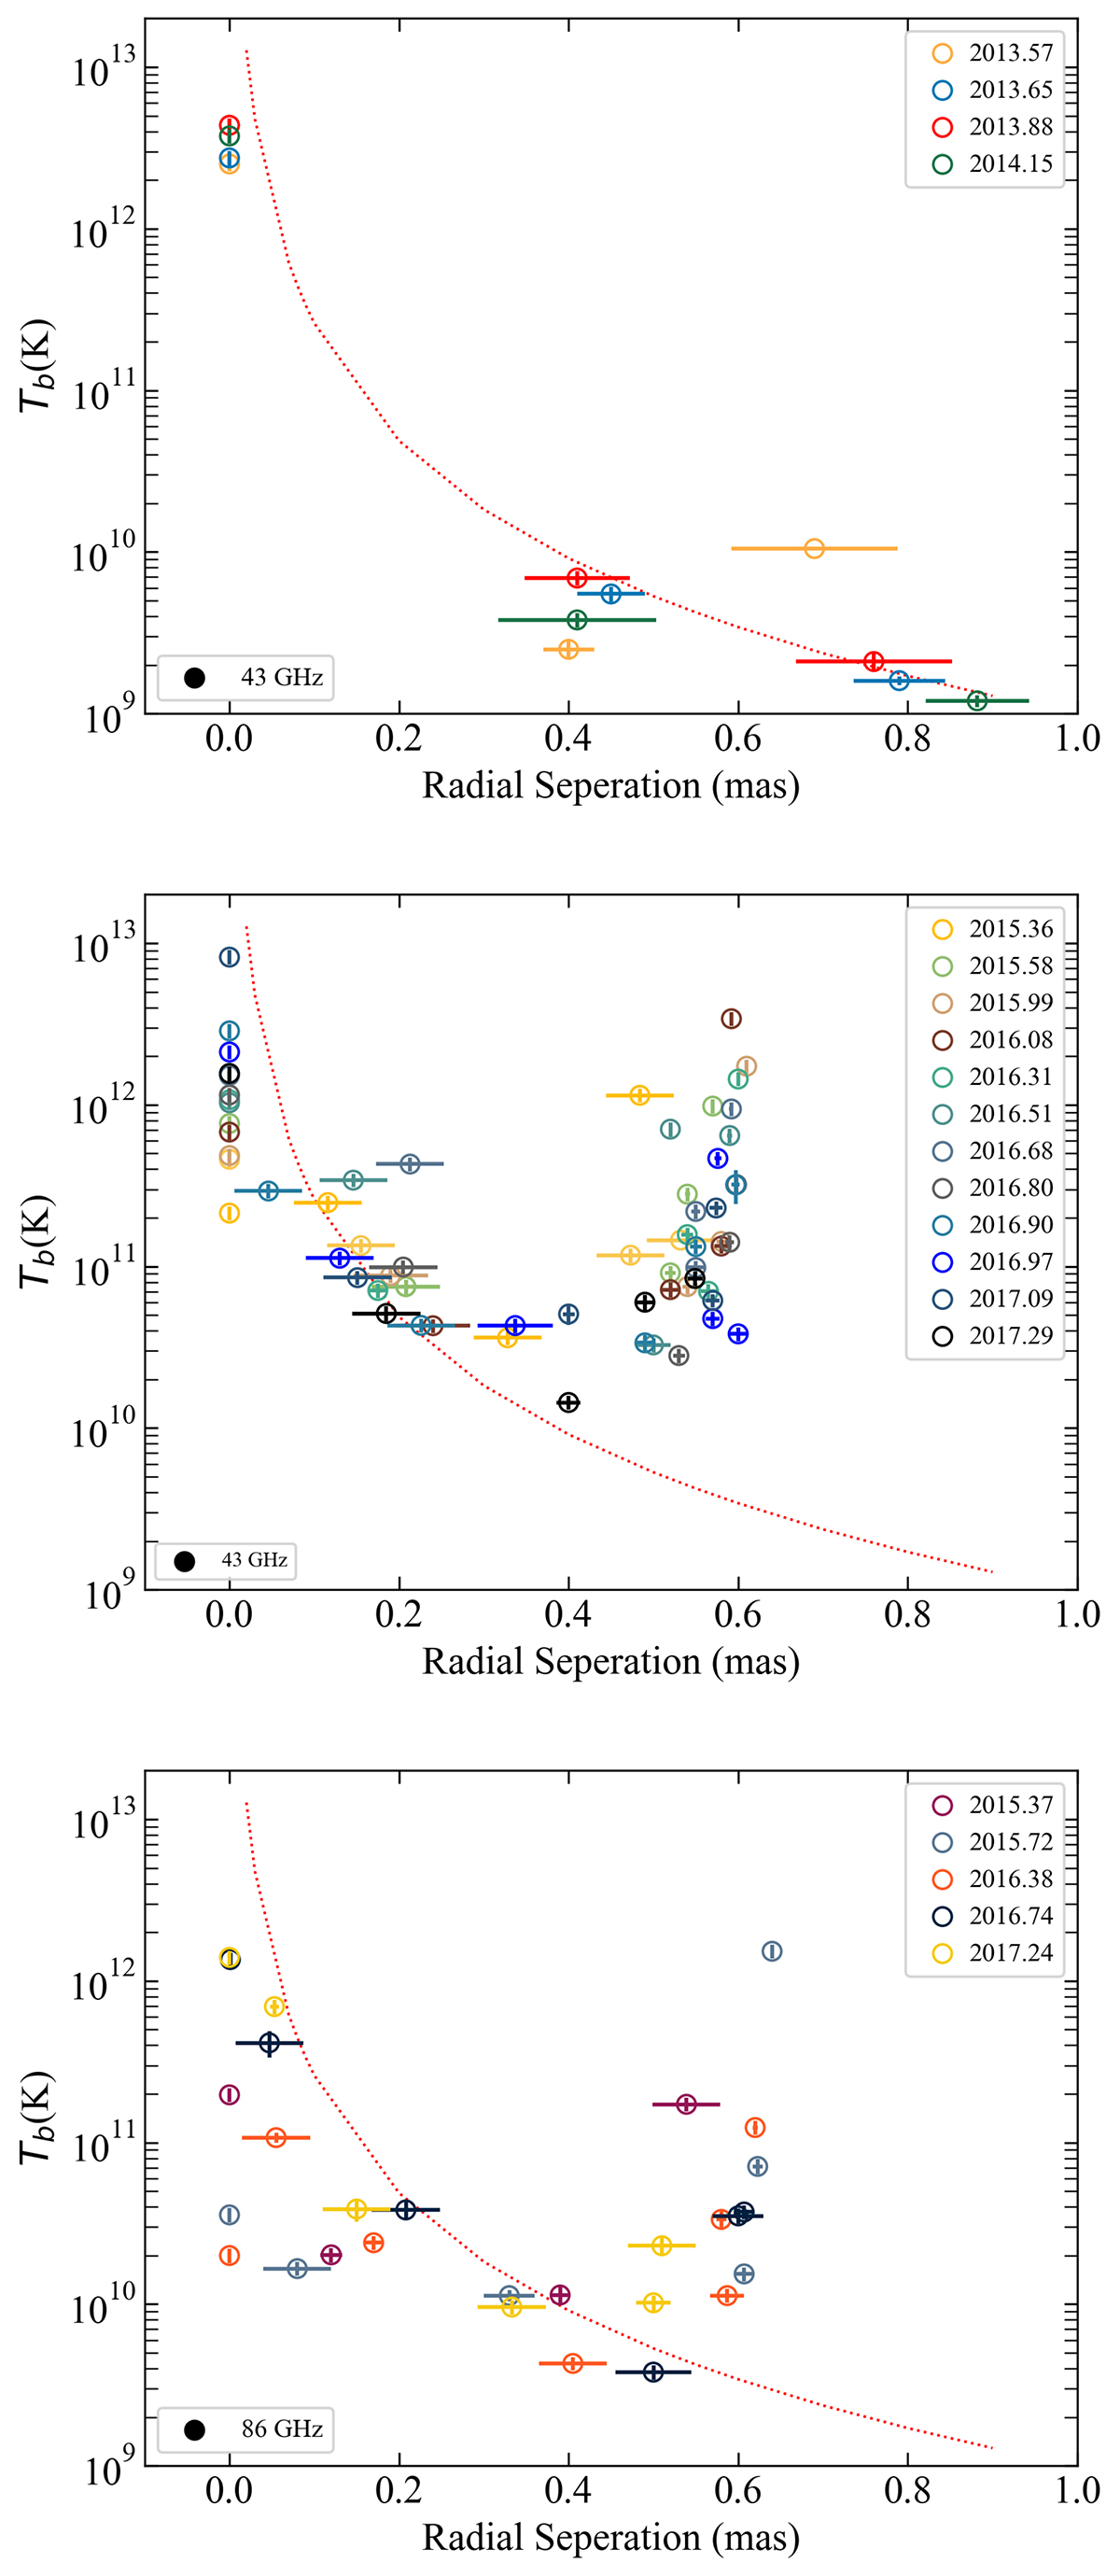
Brightness temperature evolution of all the detected components in observer’s frame at 43 and 86 GHz. Top: Tb, obs evolution versus time, before the appearance of knot M at 43 GHz. Middle: Tb, obs evolution versus time, after the appearance of the knot cluster Ca, Cb, Cc at 43 GHz. Bottom: Tb, obs evolution versus time, after the appearance of the knot cluster Ca, Cb, Cc at 86 GHz. In all three panels the red dotted line is the fit of the radial distribution of Tb, obs before the appearance of knot M.
Current usage metrics show cumulative count of Article Views (full-text article views including HTML views, PDF and ePub downloads, according to the available data) and Abstracts Views on Vision4Press platform.
Data correspond to usage on the plateform after 2015. The current usage metrics is available 48-96 hours after online publication and is updated daily on week days.
Initial download of the metrics may take a while.