Fig. 9.
Download original image
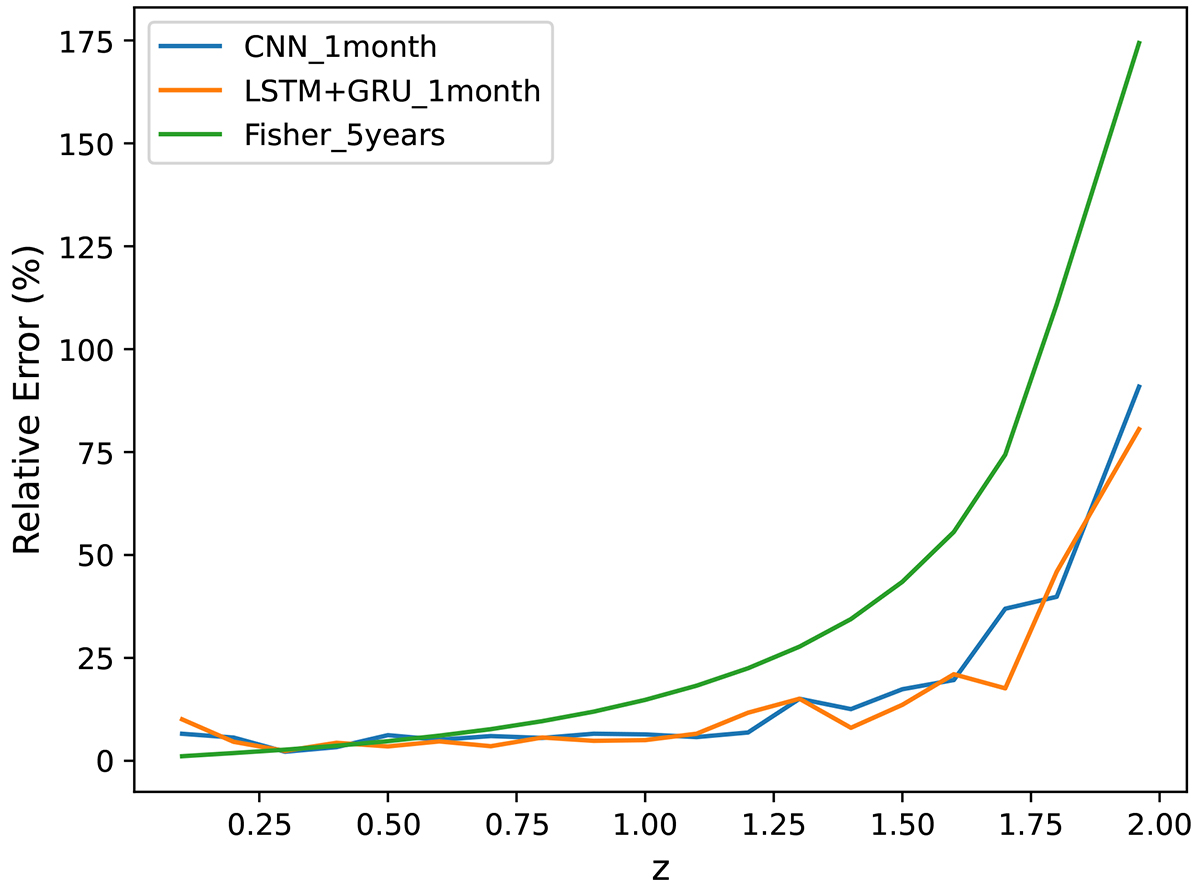
Error estimated by the Fisher matrix for 5-year observation data, shown as a green solid line. The orange solid line represents the error value estimated by the LSTM-GRU networks for one month of observation data, while the blue solid line represents the error value estimated by the CNN networks for one month of observation data.
Current usage metrics show cumulative count of Article Views (full-text article views including HTML views, PDF and ePub downloads, according to the available data) and Abstracts Views on Vision4Press platform.
Data correspond to usage on the plateform after 2015. The current usage metrics is available 48-96 hours after online publication and is updated daily on week days.
Initial download of the metrics may take a while.