Fig. 4.
Download original image
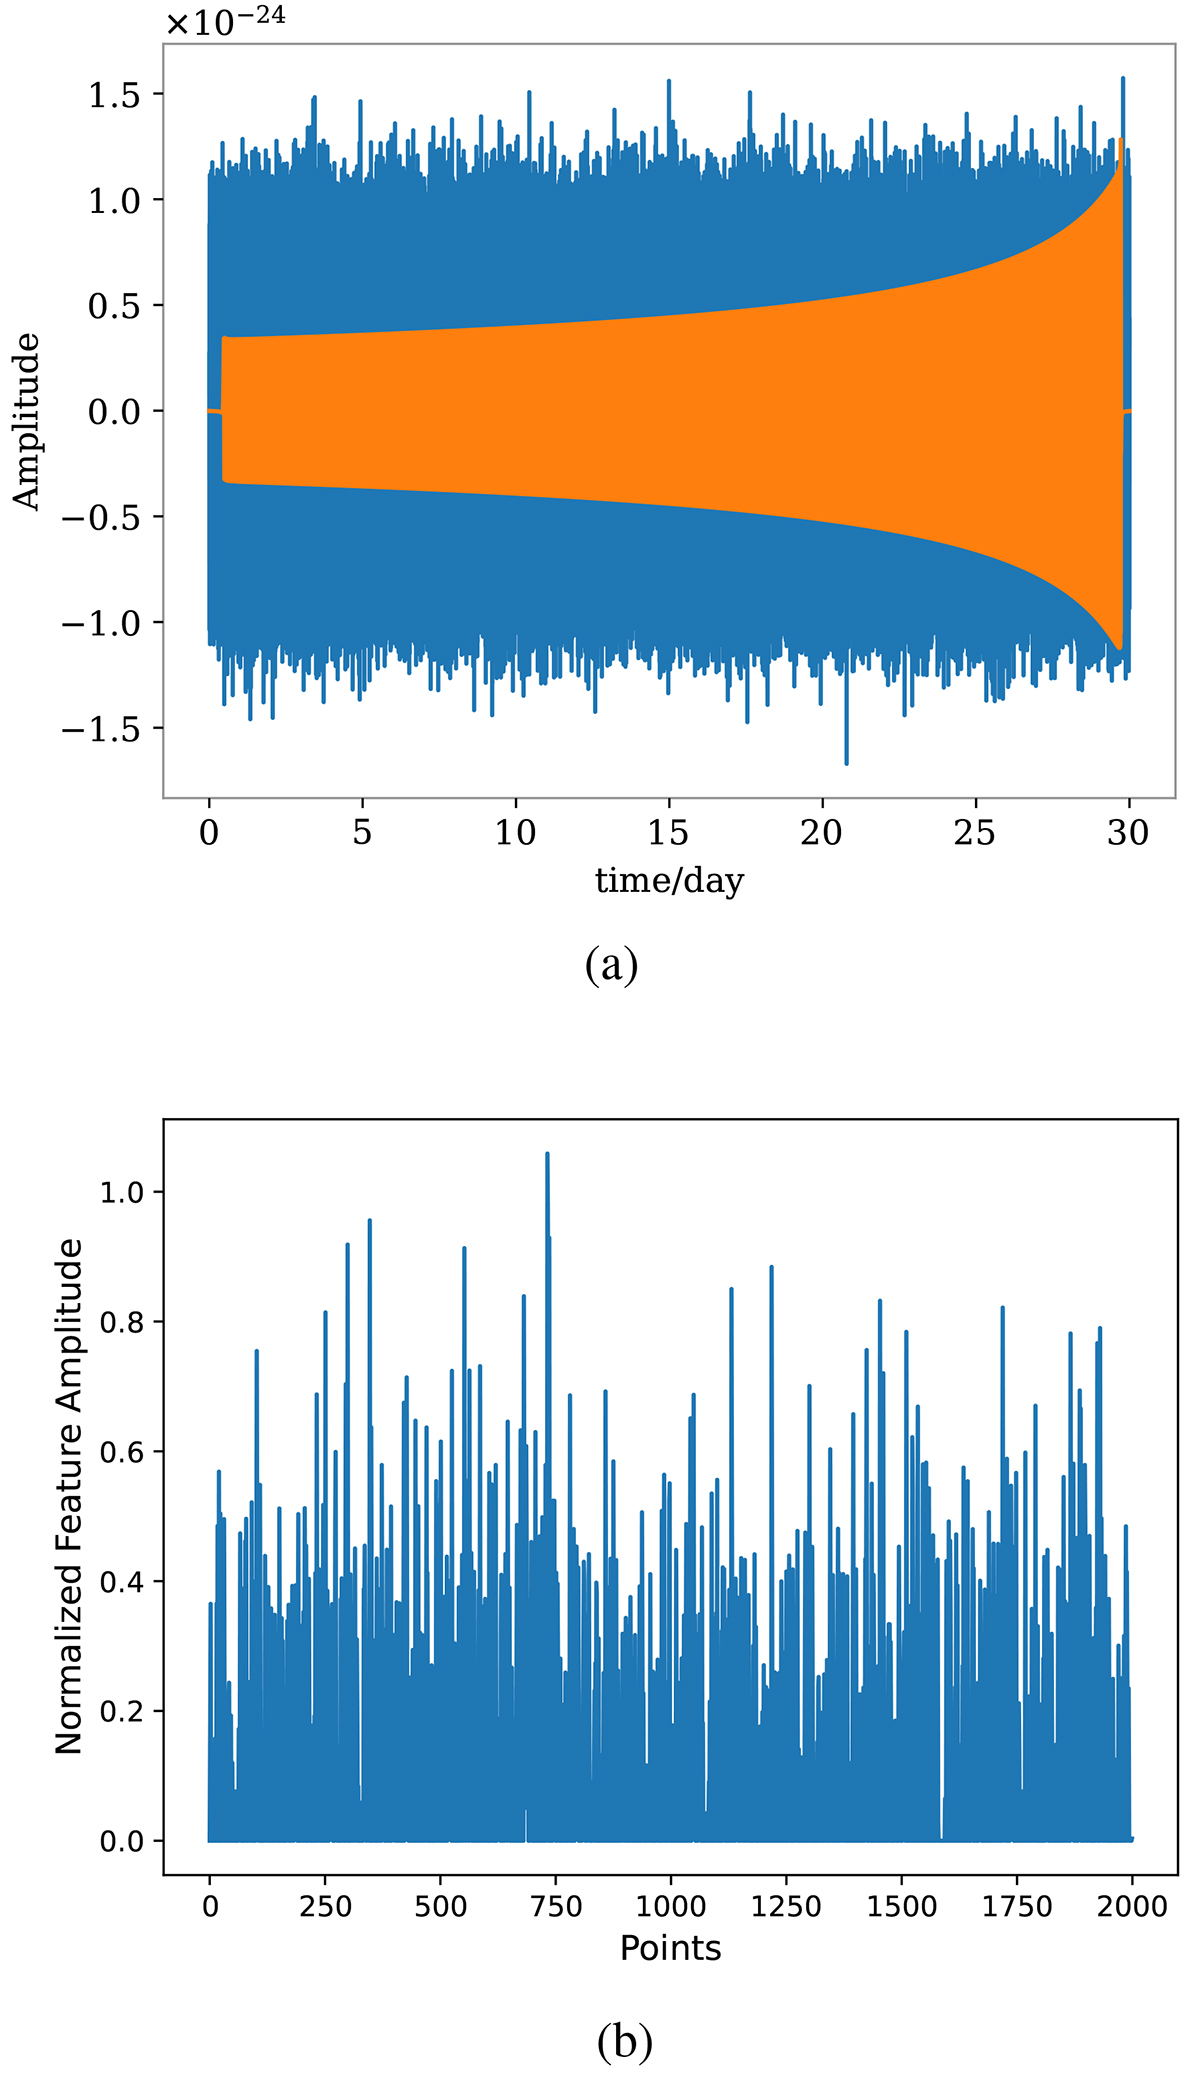
Panel a: a time-domain data sample. Noise represented as the blue curve represents, while the yellow curve shows the gravitational wave (a). The sample’s S/N is 15.739. The observation time for the signal is 1 month, with a frequency range of 0.4036 Hz–1 Hz. The gravitational wave source is a binary neutron star system with a combined mass of (1.4 + 1.4) M⊙ and a luminosity distance of DL = 3 Gpc. Other parameters are set as described in Sect. 2.3. Panel b: corresponding feature of (a), obtained through a single-layer convolutional neural network convoluting with raw data. The horizontal axis of the (b) represents the data length, while the vertical axis represents the normalized feature amplitude.
Current usage metrics show cumulative count of Article Views (full-text article views including HTML views, PDF and ePub downloads, according to the available data) and Abstracts Views on Vision4Press platform.
Data correspond to usage on the plateform after 2015. The current usage metrics is available 48-96 hours after online publication and is updated daily on week days.
Initial download of the metrics may take a while.