Open Access
Fig. 2.
Download original image
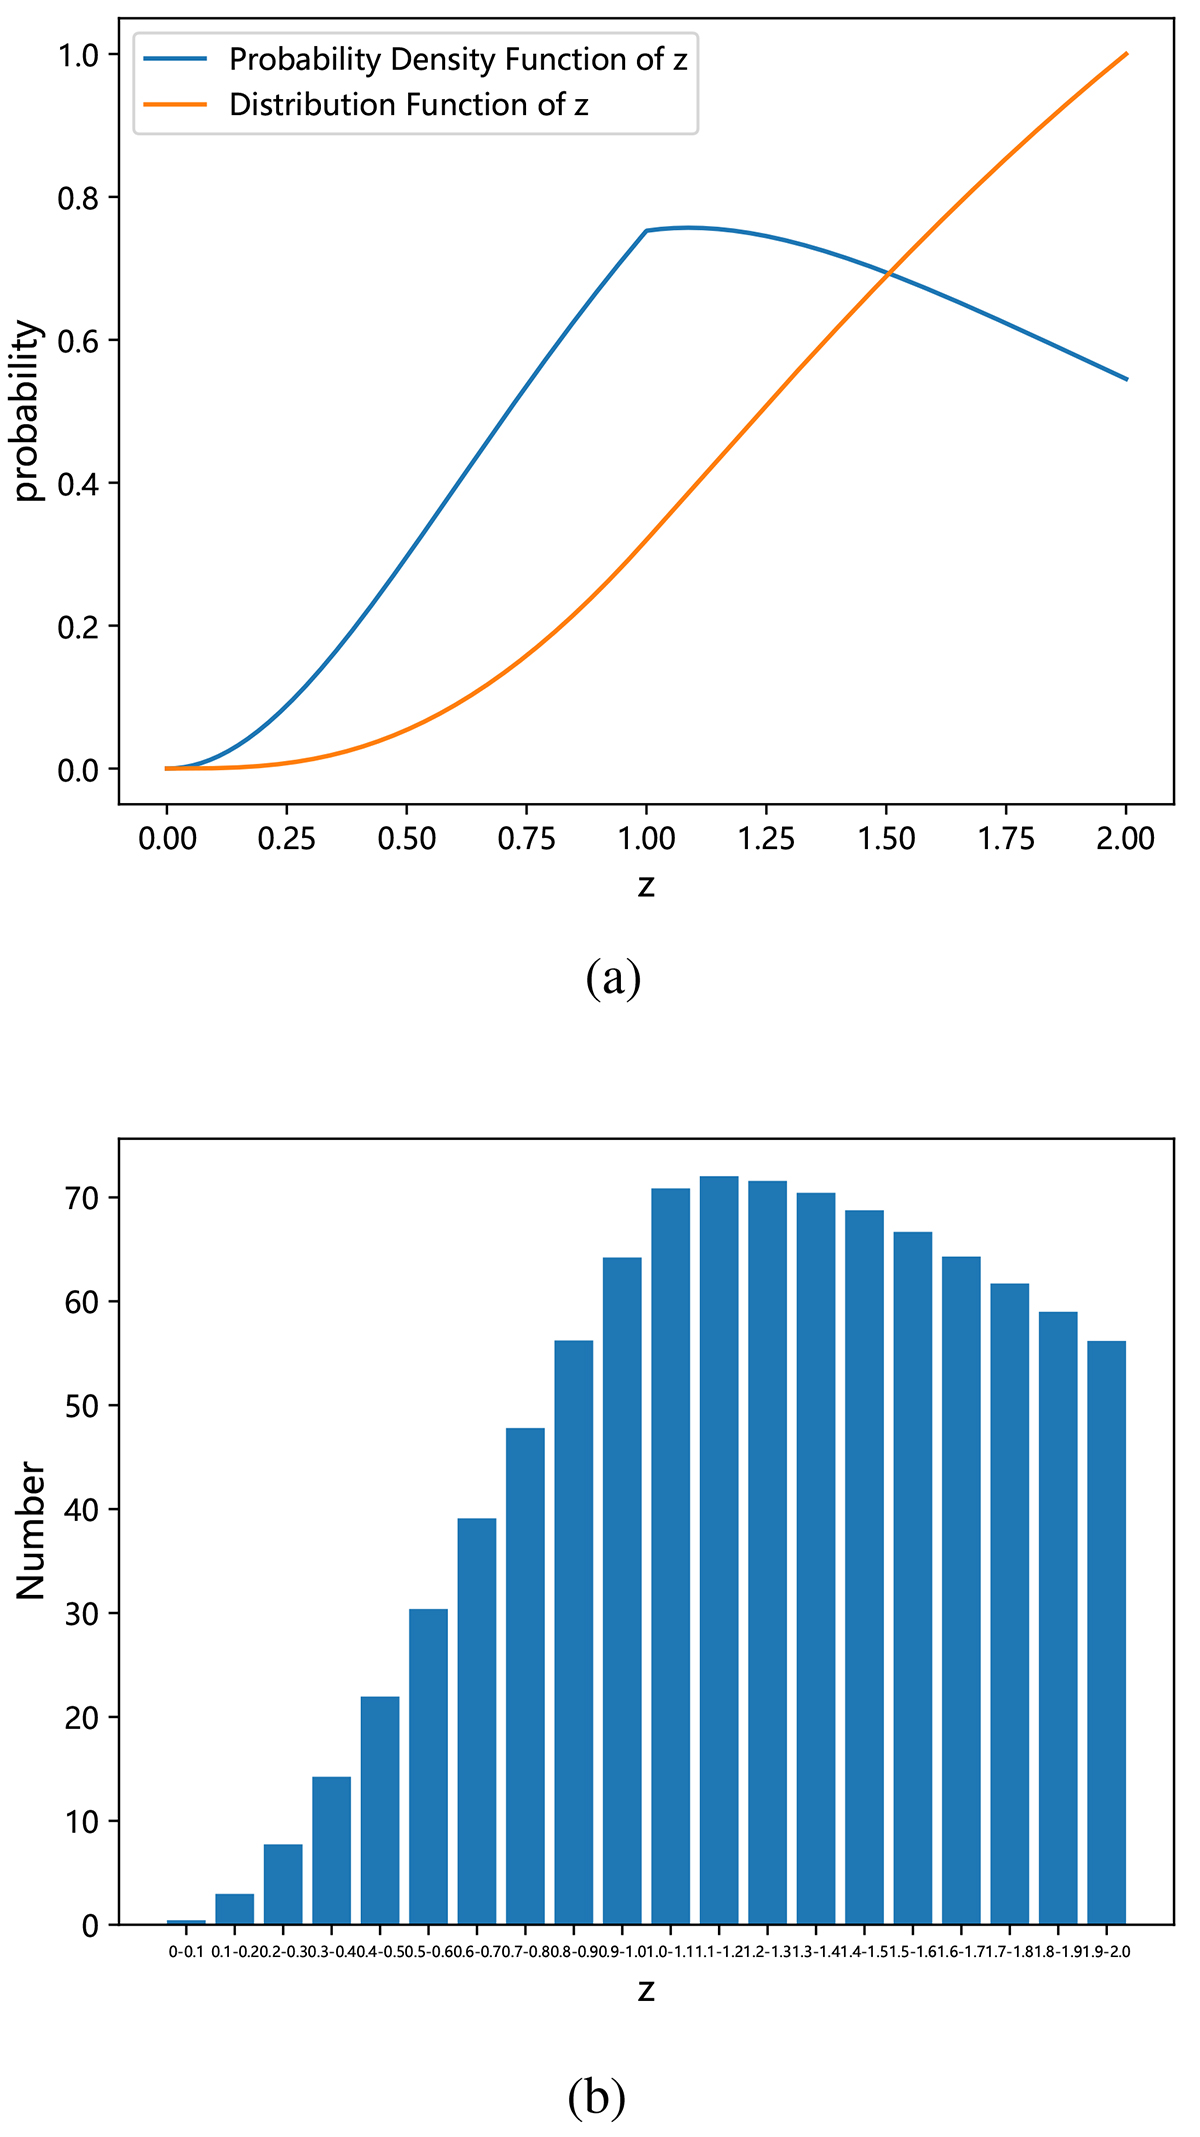
Redshift distribution function and the samples generated according to this distribution. Panel a: probability density function and distribution function of redshift. Panel b: redshift distribution of 1000 sources. The x-axis and y-axis denote the range of each interval and the number of GW sources in each interval.
Current usage metrics show cumulative count of Article Views (full-text article views including HTML views, PDF and ePub downloads, according to the available data) and Abstracts Views on Vision4Press platform.
Data correspond to usage on the plateform after 2015. The current usage metrics is available 48-96 hours after online publication and is updated daily on week days.
Initial download of the metrics may take a while.