Fig. 6
Download original image
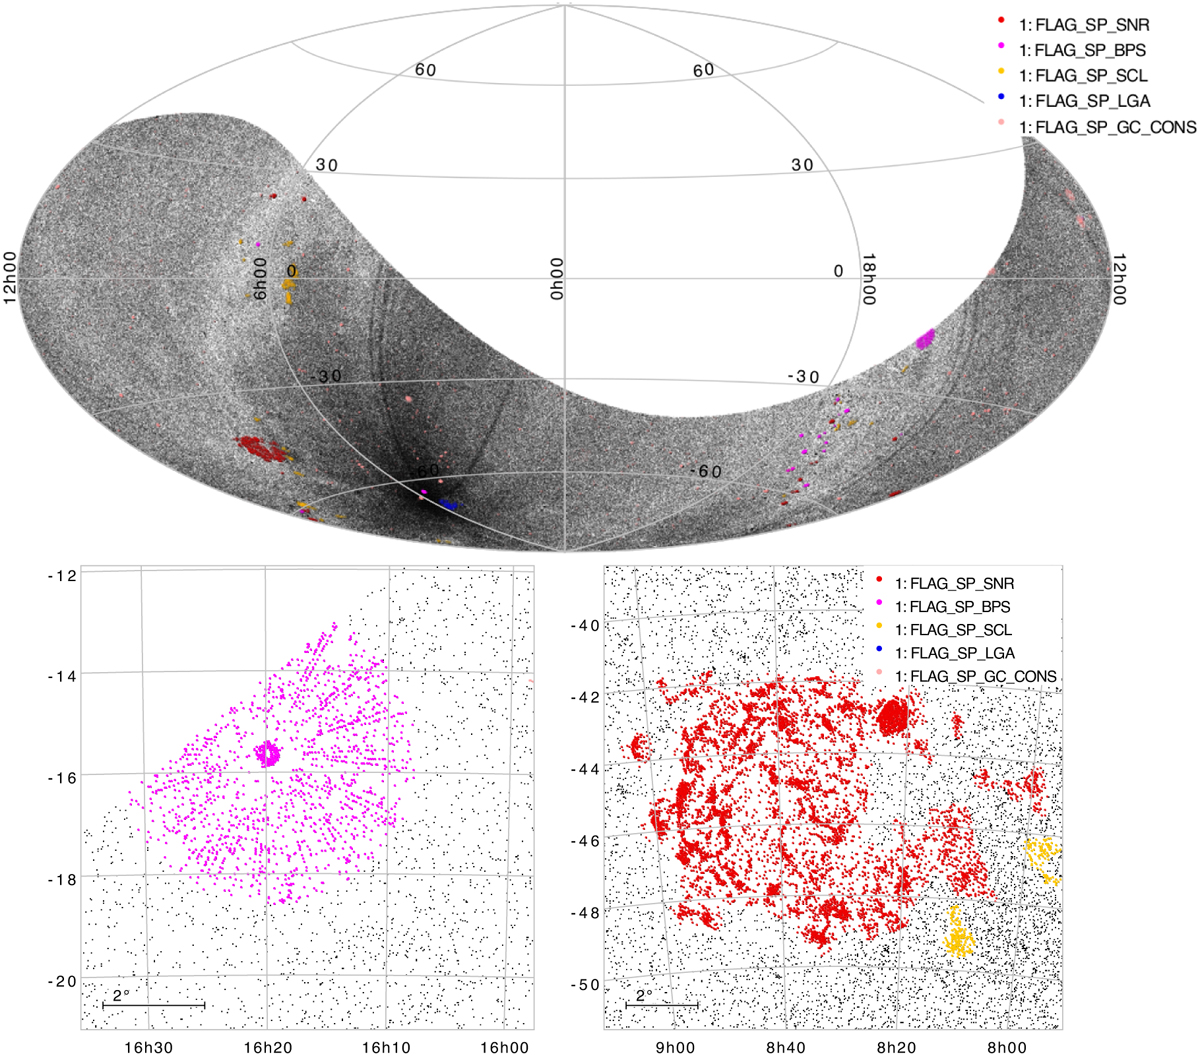
Top panel: Aitoff projection of the eRASS1 1B catalogue in Equatorial coordinates (J2000), with each grey point representing a detected source within the catalogue, and the coloured points denoting sources that have been flagged as potentially spurious according to the scheme presented in Table 5. Darker stripes are due to larger sources density due to a higher exposure in those parts of the sky. Bottom left: zoom in plot of sources detected within the vicinity of Sco X-1, with pink sources flagged as potentially spurious using the FLAG_SP_BPS column in the catalogue. Bottom right: similar for sources within the vicinity of the Vela SNR.
Current usage metrics show cumulative count of Article Views (full-text article views including HTML views, PDF and ePub downloads, according to the available data) and Abstracts Views on Vision4Press platform.
Data correspond to usage on the plateform after 2015. The current usage metrics is available 48-96 hours after online publication and is updated daily on week days.
Initial download of the metrics may take a while.