Open Access
Fig. 2.
Download original image
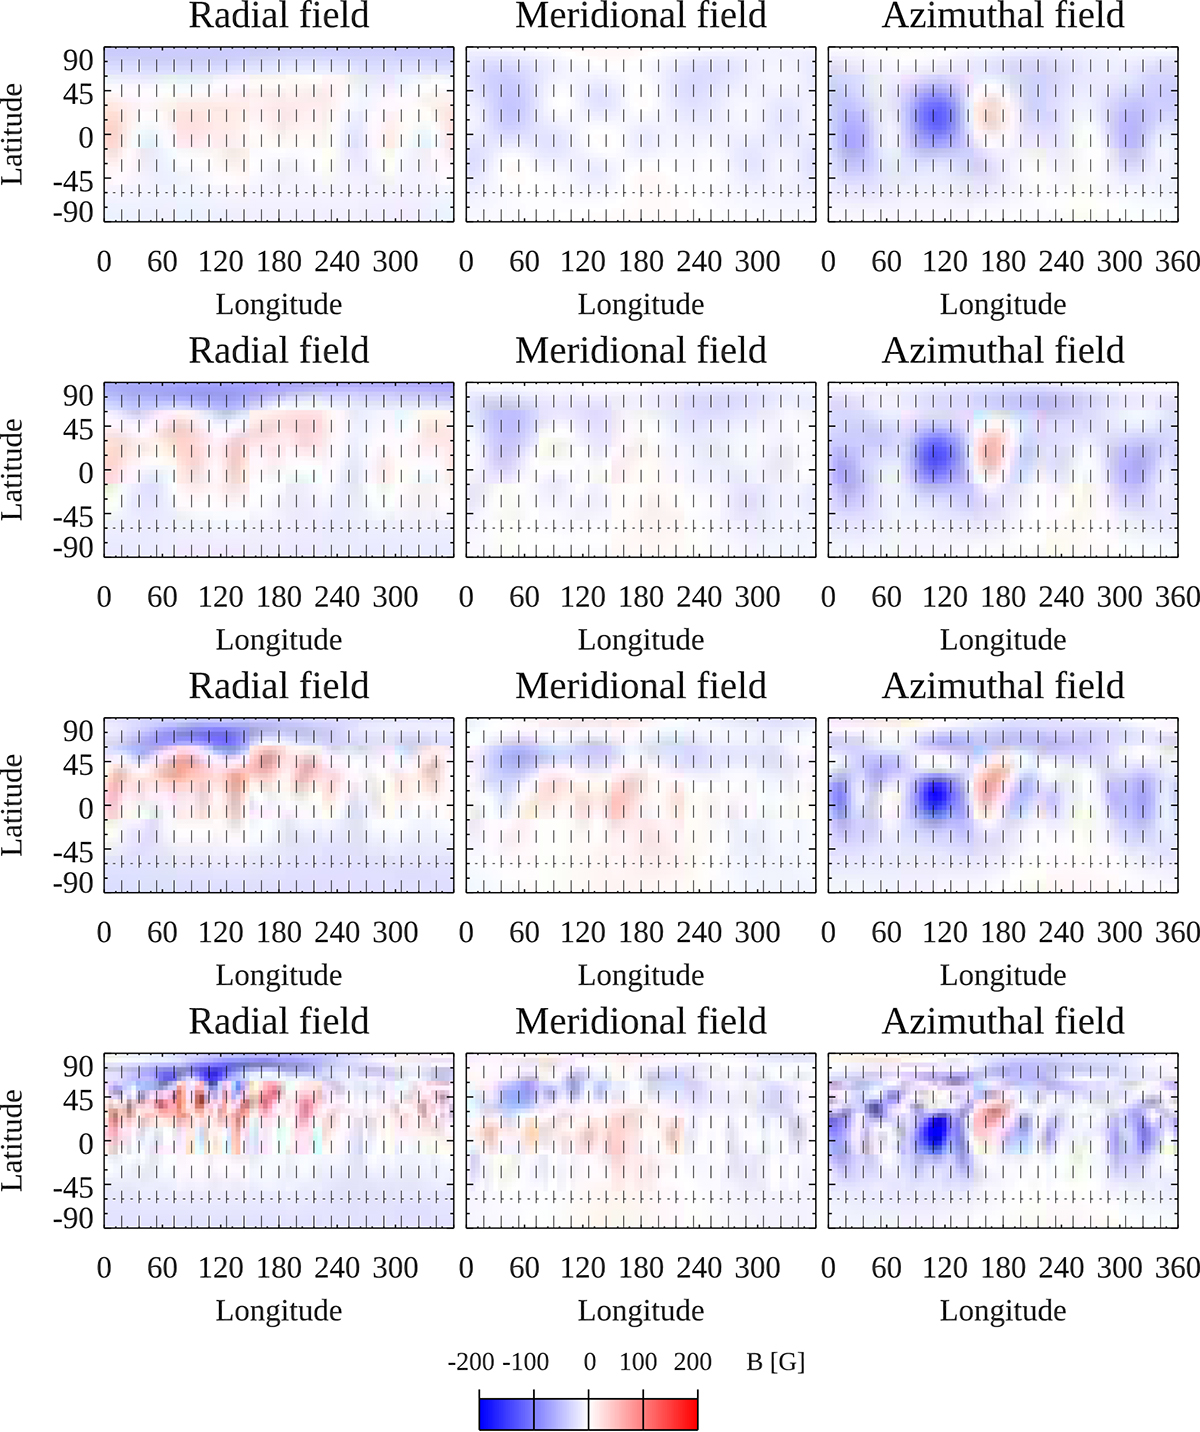
Resulting ZDI map for Tests 1–4 using simulation C1. Top to bottom row: increase in v sin i (5, 10, 20, and 40 km s−1). The vertical lines mark the rotational phases of the simulated spectra. The horizontal line marks the visibility limit due to the rotational axis inclination i.
Current usage metrics show cumulative count of Article Views (full-text article views including HTML views, PDF and ePub downloads, according to the available data) and Abstracts Views on Vision4Press platform.
Data correspond to usage on the plateform after 2015. The current usage metrics is available 48-96 hours after online publication and is updated daily on week days.
Initial download of the metrics may take a while.