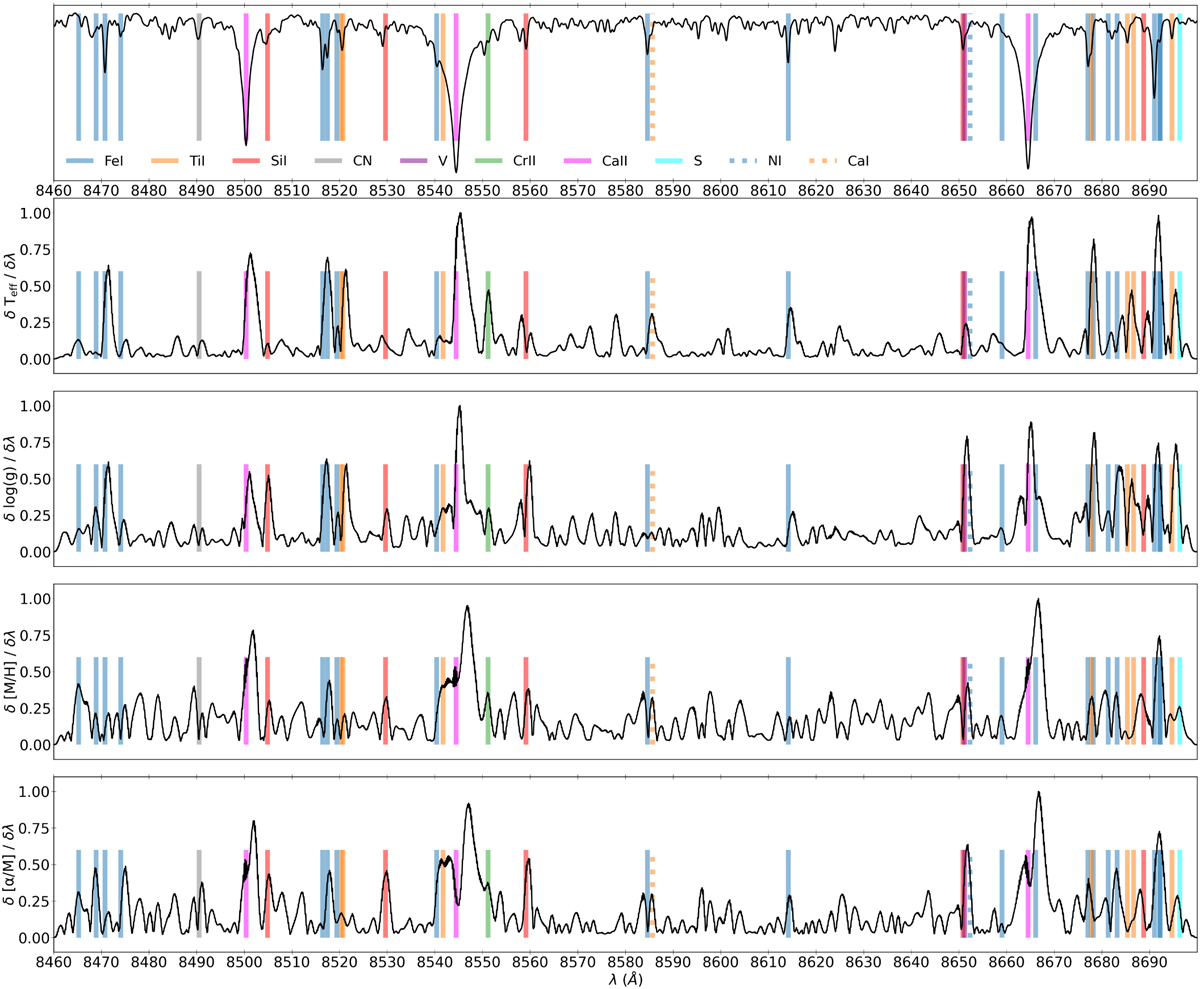
Fig. 9
Download original image
Gaia RVS spectral sensitivity maps of CNN. Top: mean RVS spectra of training sample RC stars with [M/H] ~ 0. In the next sub-panels, we show the mean gradients of the CNN output labels with respect to the input RVS pixels for Teff, log(g), [M/H], and [α/M] (δlabel/δλ). The vertical coloured lines show the location of the main RVS spectral features from which CNN learns (see Sect. 3.5.1).
Current usage metrics show cumulative count of Article Views (full-text article views including HTML views, PDF and ePub downloads, according to the available data) and Abstracts Views on Vision4Press platform.
Data correspond to usage on the plateform after 2015. The current usage metrics is available 48-96 hours after online publication and is updated daily on week days.
Initial download of the metrics may take a while.