Fig. 8
Download original image
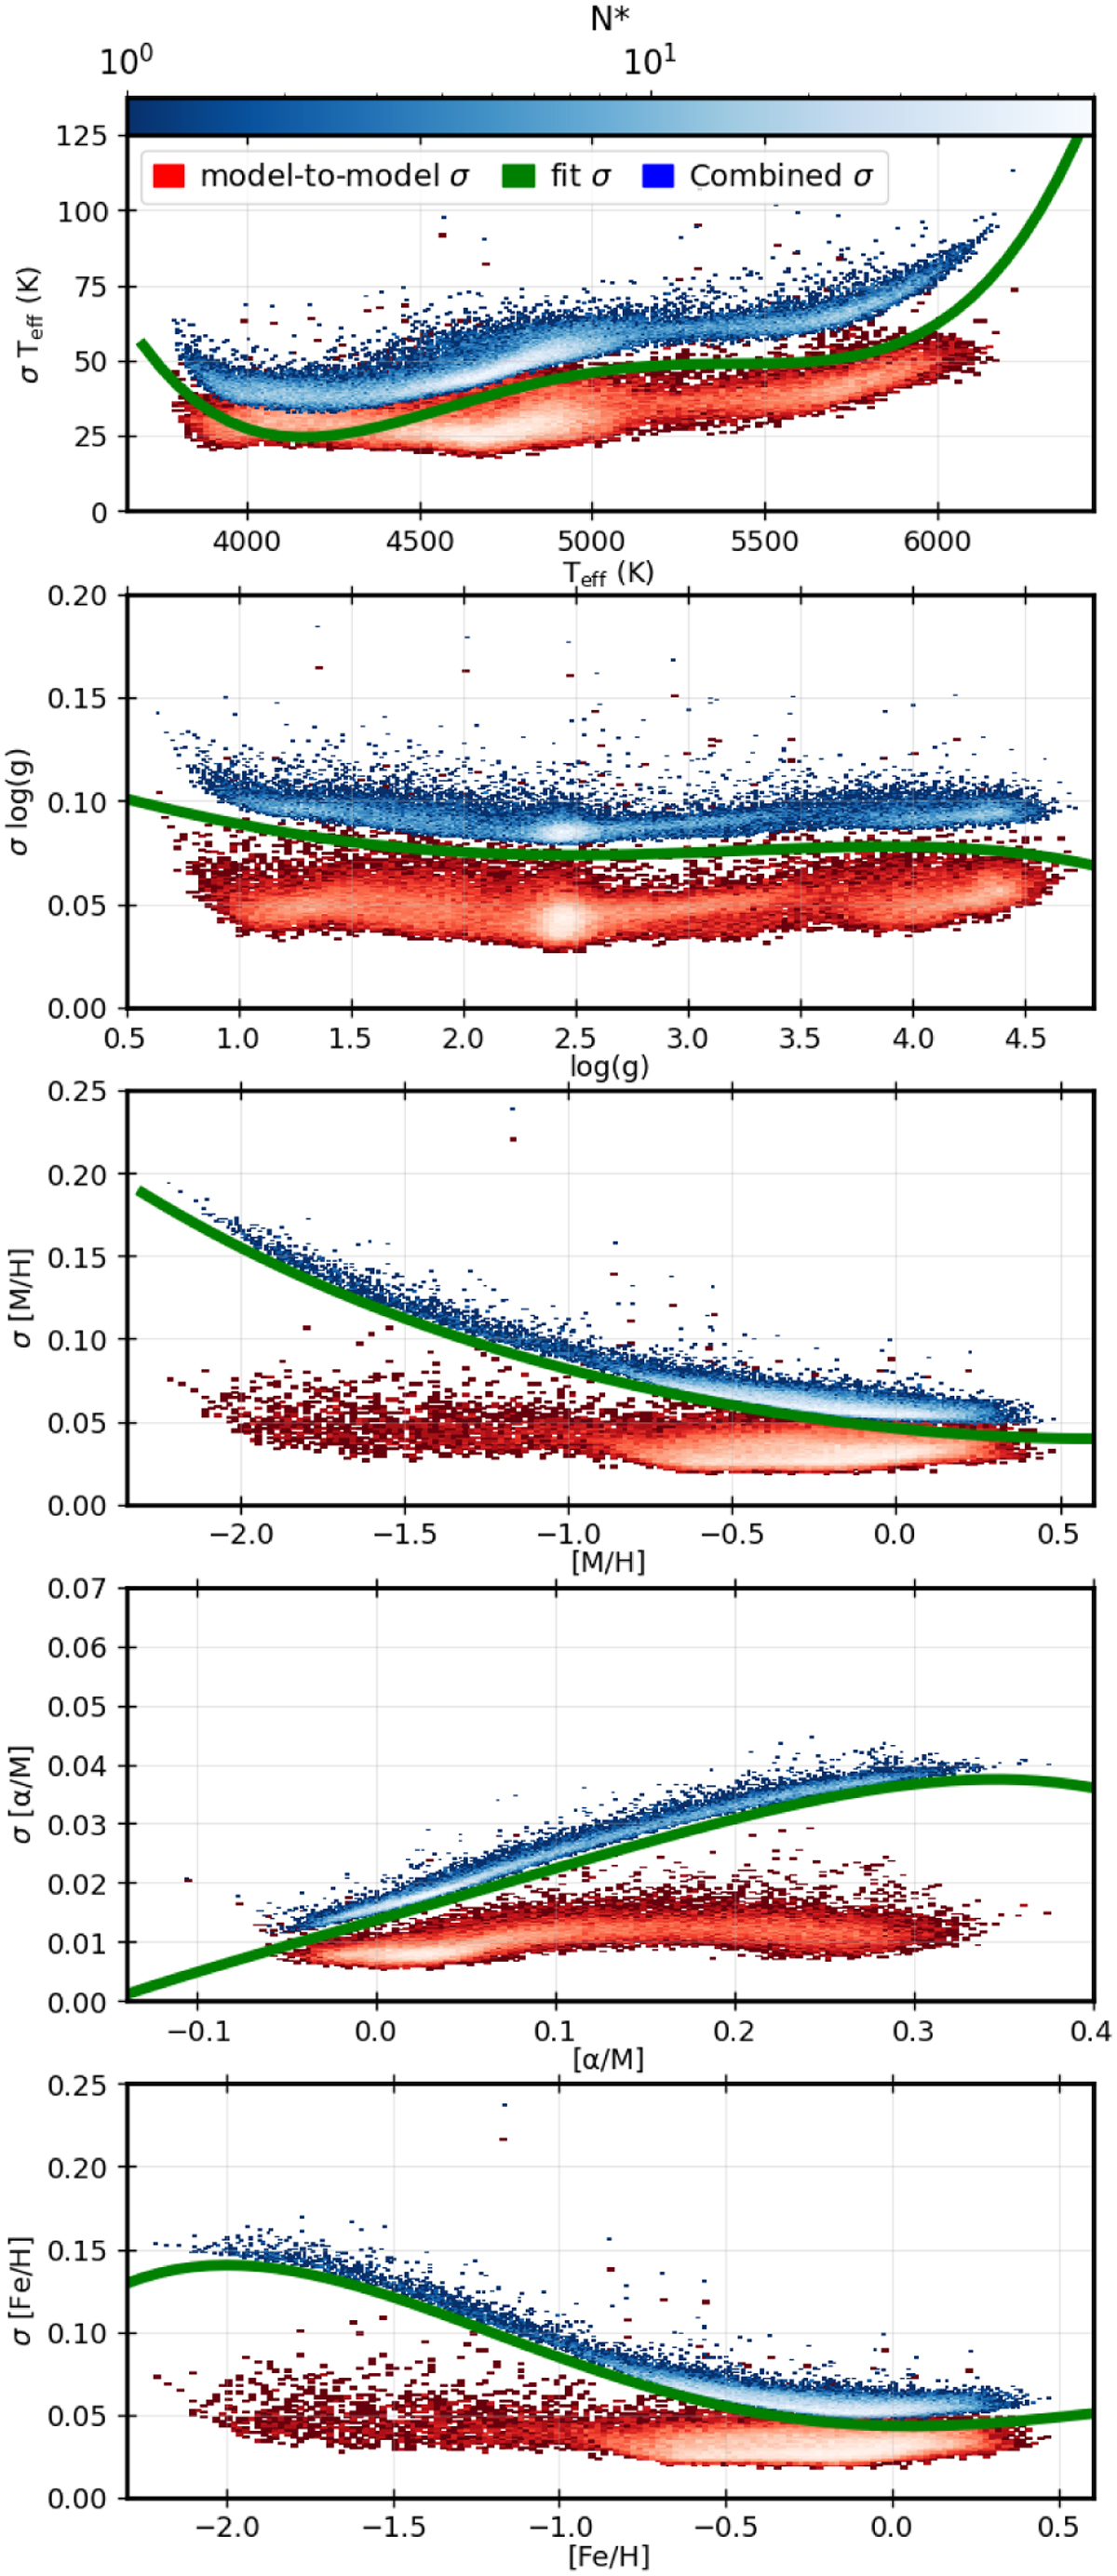
Convolutional neural network uncertainties of the training sample as a function of CNN output labels. The 2D density distribution in the red colourmap corresponds to the internal precision computed over the 28 CNN models. The green fit corresponds to the running dispersion computed from the residual of CNN-APOGEE training labels (see Fig. 7). The 2D histogram in the blue colourmap corresponds to the quadratic sum of the internal precision and running dispersion, and defines our overall uncertainty.
Current usage metrics show cumulative count of Article Views (full-text article views including HTML views, PDF and ePub downloads, according to the available data) and Abstracts Views on Vision4Press platform.
Data correspond to usage on the plateform after 2015. The current usage metrics is available 48-96 hours after online publication and is updated daily on week days.
Initial download of the metrics may take a while.