Fig. 7
Download original image
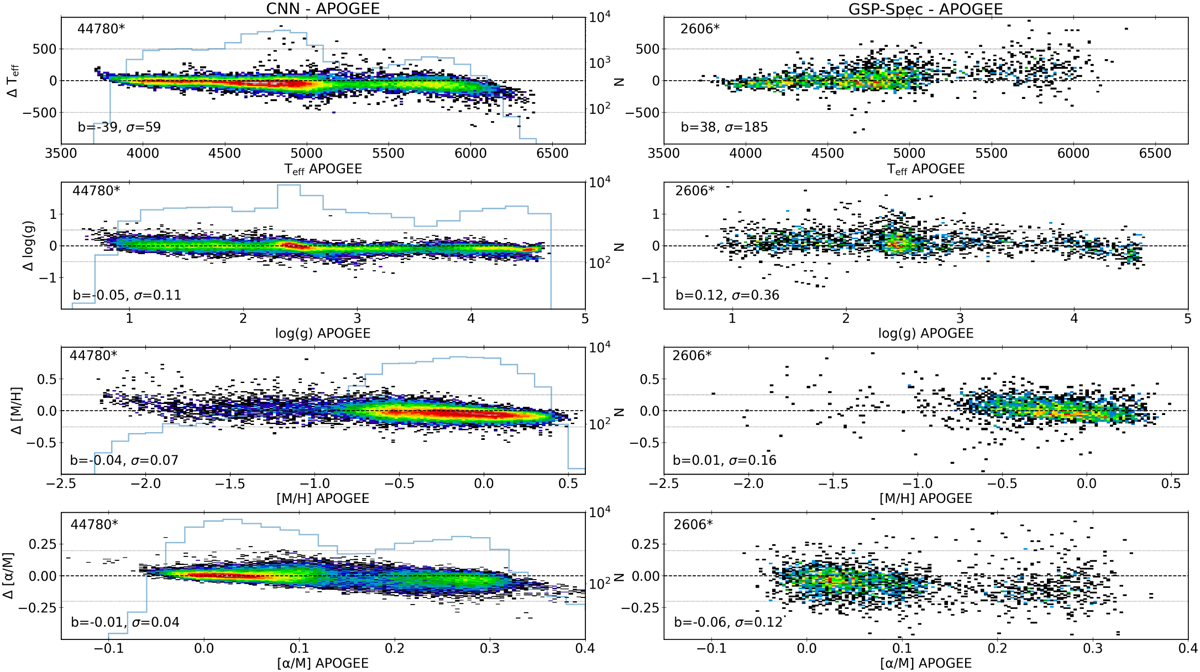
Two-dimensional density distribution of the residual between trained CNN labels and APOGEE input labels as a function of the APOGEE input labels for the training sample (44780 stars, left column). The black dashed line shows a null difference. The mean bias (b) and dispersion (σ) of the difference is given in the bottom-left corner of the panels. Each panel also contains a histogram of the input label. The right panels show differences between the calibrated GSP-Spec parameters (with good quality flags; Recio-Blanco et al. 2023) and APOGEE labels.
Current usage metrics show cumulative count of Article Views (full-text article views including HTML views, PDF and ePub downloads, according to the available data) and Abstracts Views on Vision4Press platform.
Data correspond to usage on the plateform after 2015. The current usage metrics is available 48-96 hours after online publication and is updated daily on week days.
Initial download of the metrics may take a while.