Open Access
Fig. 24
Download original image
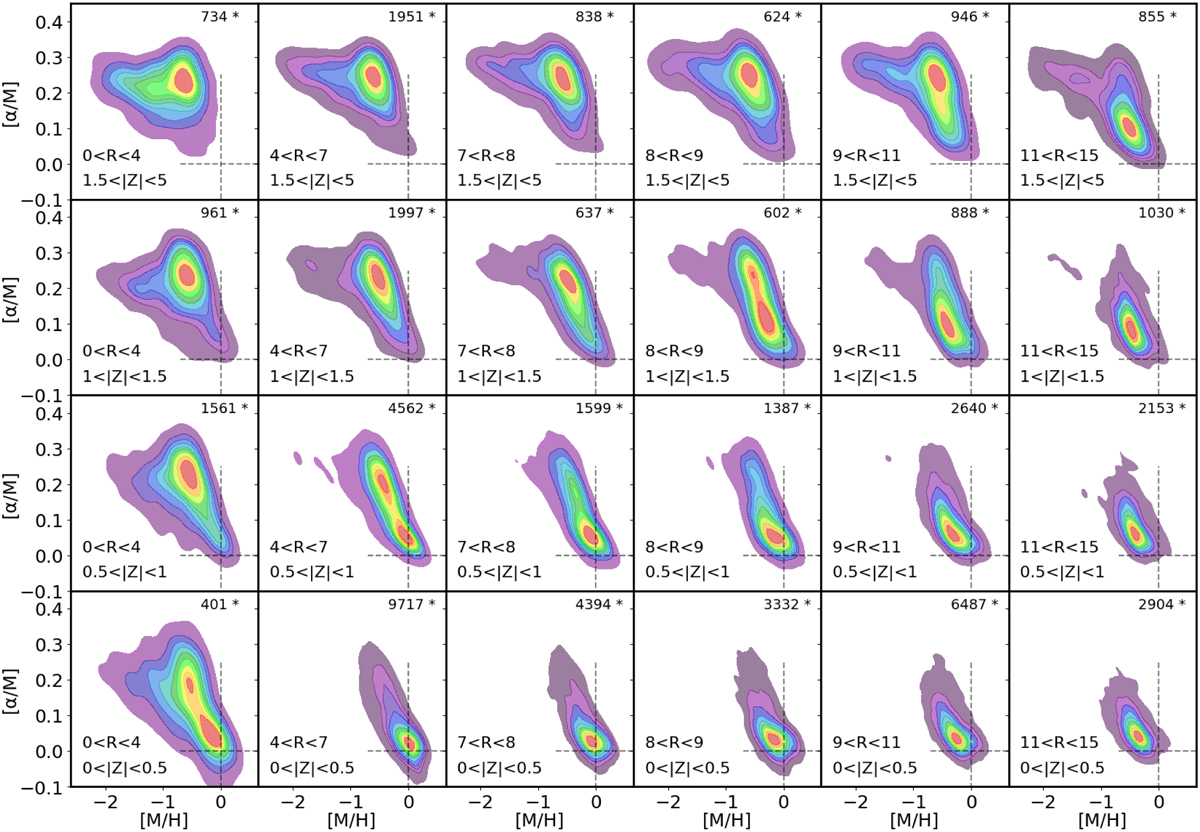
Two-dimensional histograms and contours of [α/M] vs. [M/H] in 53 200 Gaia-RVS giants of the observed sample with 15 ≤ S /N ≤ 25 and log(g) ≤ 2.2 within the training sample limits. The stars are plotted in kiloparsec bins of galactocentric radius (R) and height above the galactic plane (Z).
Current usage metrics show cumulative count of Article Views (full-text article views including HTML views, PDF and ePub downloads, according to the available data) and Abstracts Views on Vision4Press platform.
Data correspond to usage on the plateform after 2015. The current usage metrics is available 48-96 hours after online publication and is updated daily on week days.
Initial download of the metrics may take a while.