Open Access
Fig. 15
Download original image
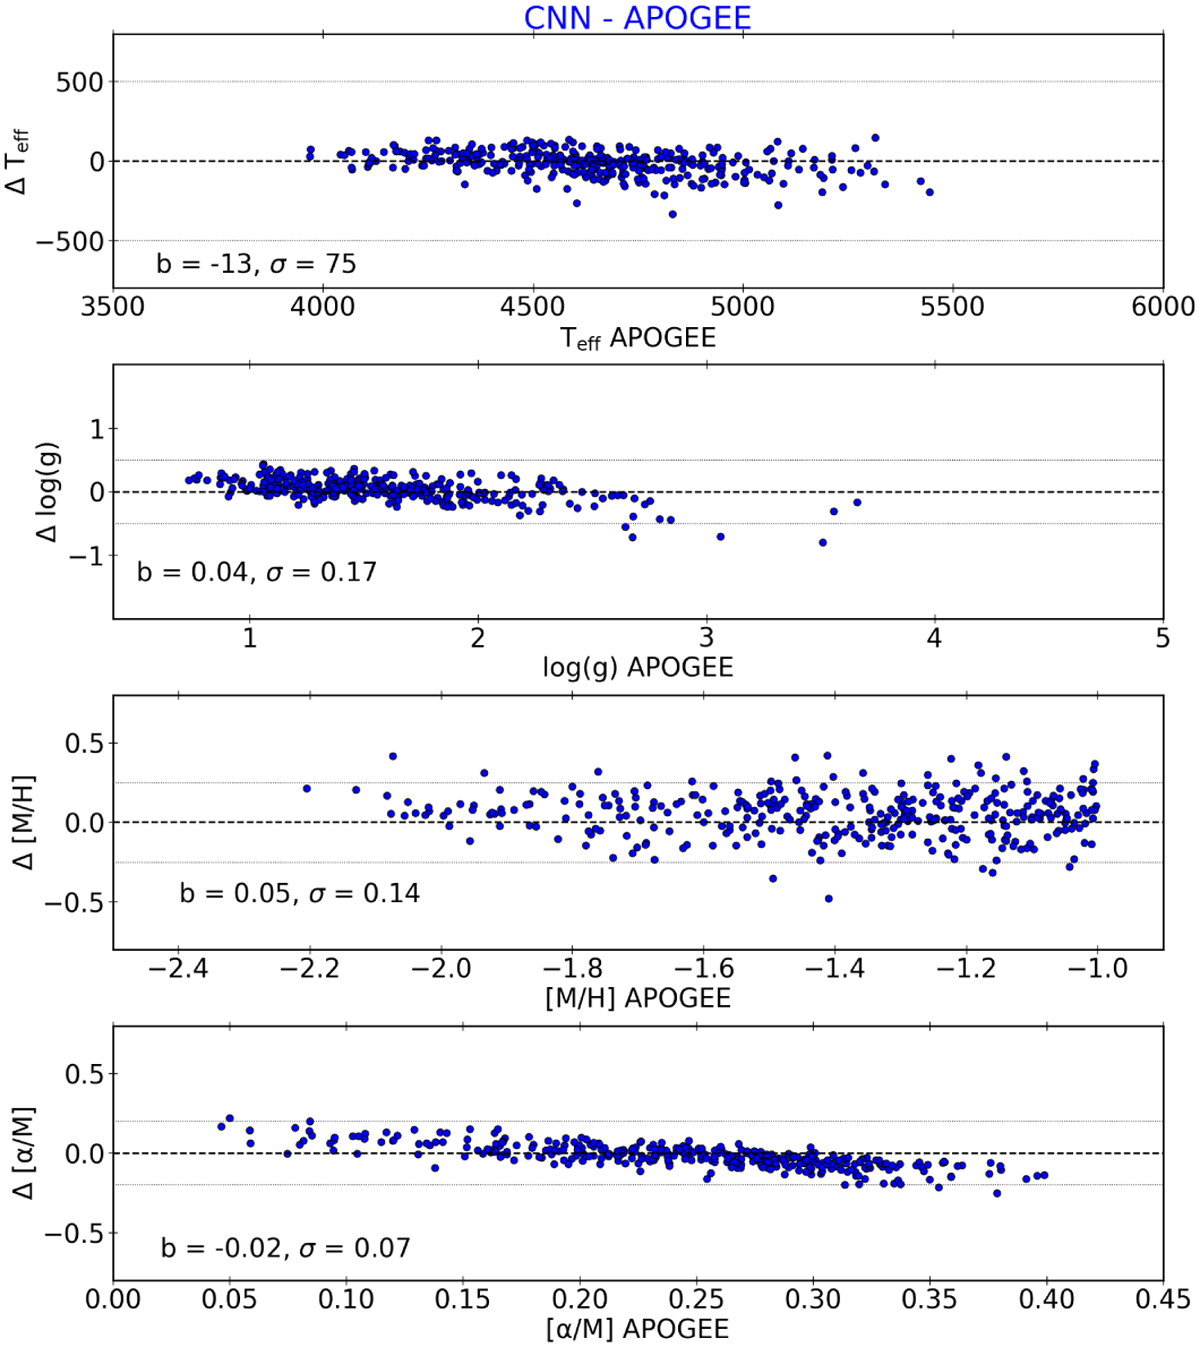
Residual between the CNN and APOGEE parameters as a function of APOGEE for 353 metal-poor stars ([M/H]APOGEE < −1 dex) in the observed sample in the range 15 < S /N < 25. The black dashed line shows a null difference. The mean bias (b) and dispersion (σ) of the difference is given in the bottom-left corner.
Current usage metrics show cumulative count of Article Views (full-text article views including HTML views, PDF and ePub downloads, according to the available data) and Abstracts Views on Vision4Press platform.
Data correspond to usage on the plateform after 2015. The current usage metrics is available 48-96 hours after online publication and is updated daily on week days.
Initial download of the metrics may take a while.