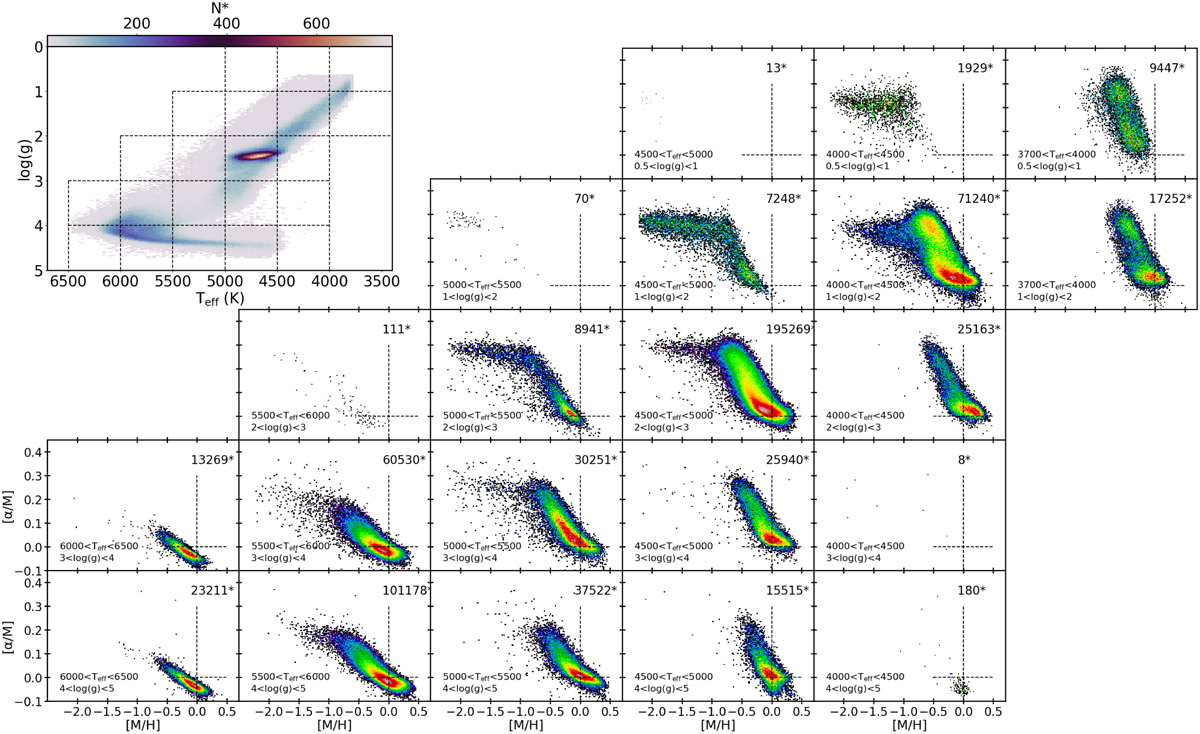
Fig. 14
Download original image
Representation of [α/M] versus [M/H] for 644287 Gaia-RVS stars of the observed sample within the training sample limits. The sample is presented in panels corresponding to cuts in the effective temperature and surface gravity (steps of 500 K in Teff and 1 dex in log(g)). In the top-left corner, we show a Kiel diagram of the sample to guide the eye.
Current usage metrics show cumulative count of Article Views (full-text article views including HTML views, PDF and ePub downloads, according to the available data) and Abstracts Views on Vision4Press platform.
Data correspond to usage on the plateform after 2015. The current usage metrics is available 48-96 hours after online publication and is updated daily on week days.
Initial download of the metrics may take a while.