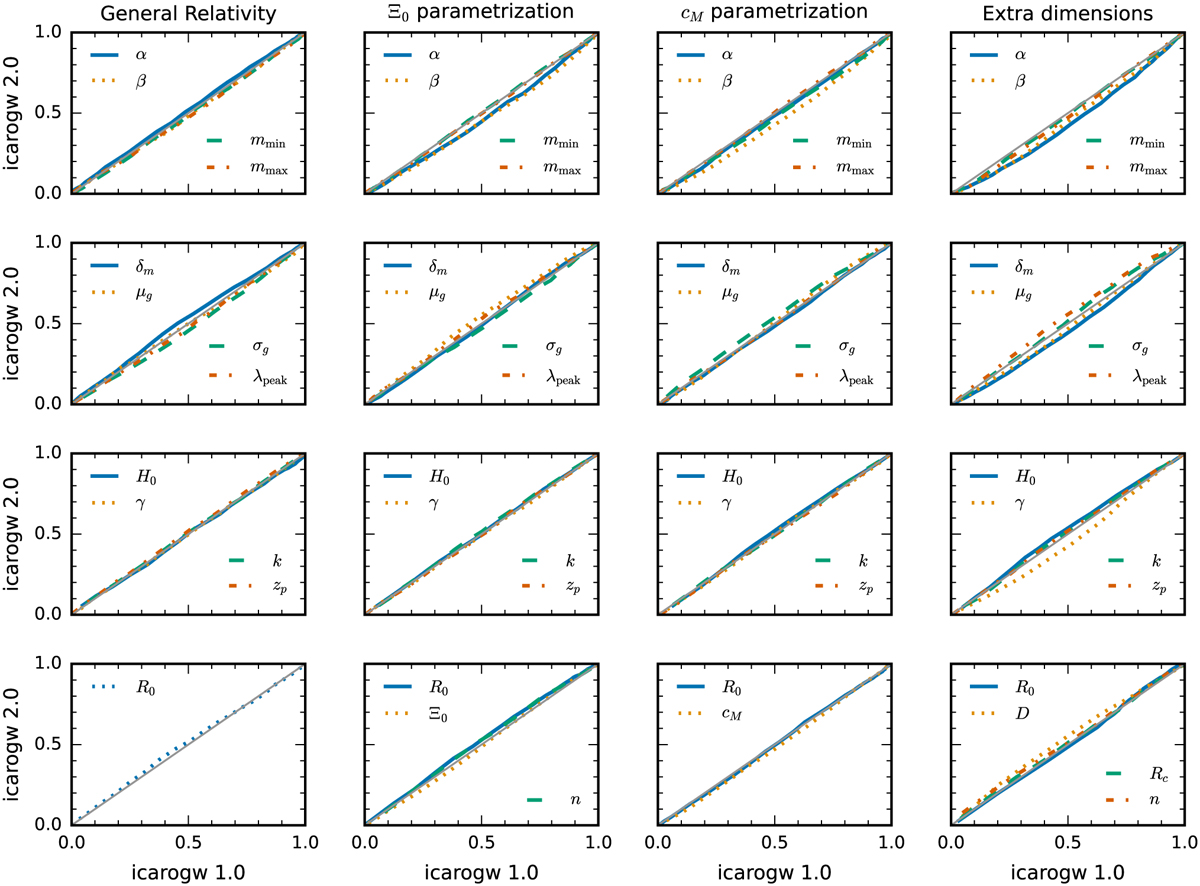
Fig. 3
Download original image
Quantile-quantile plots of the marginal posterior distributions of the CBC merger rate population parameters inferred from the 42 BBHs in GWTC-3. The plots columns correspond to the model used to calculate the GW luminosity distance as a function of redshift, see Appendices A.1–A.2. The legend and different lines report the population parameters. All the benchmark runs use the POWER LAW + PEAK model for the source mass (cf. Appendix B.2) and the MADAU-DICKINSON merger rate model (cf. Appendix B.1).
Current usage metrics show cumulative count of Article Views (full-text article views including HTML views, PDF and ePub downloads, according to the available data) and Abstracts Views on Vision4Press platform.
Data correspond to usage on the plateform after 2015. The current usage metrics is available 48-96 hours after online publication and is updated daily on week days.
Initial download of the metrics may take a while.