Open Access
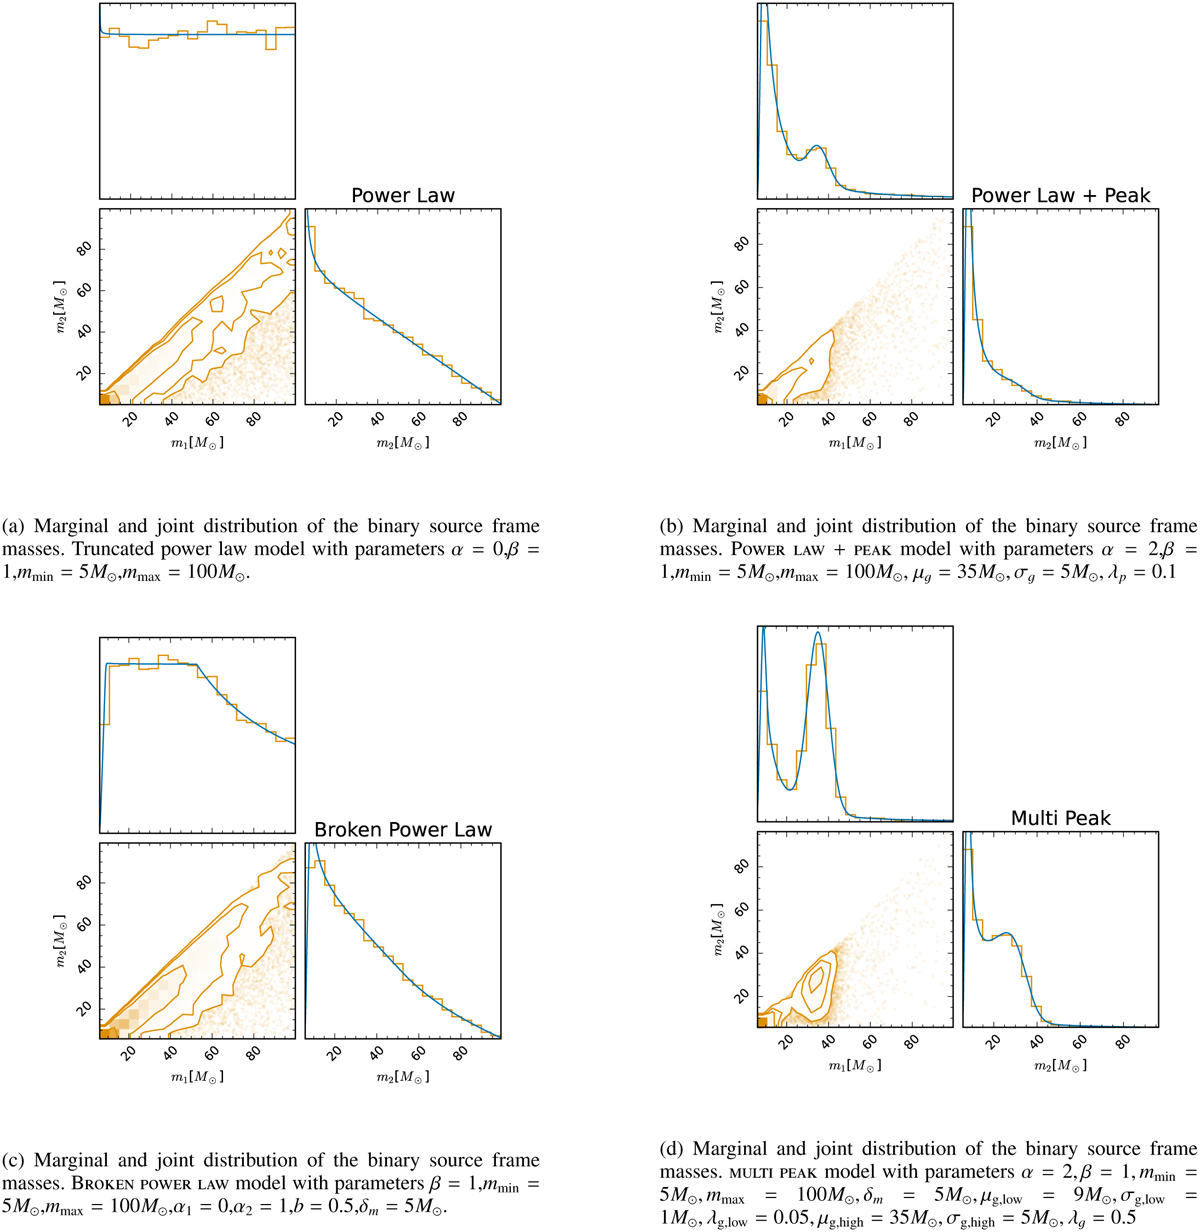
Fig. B.2
Download original image
Sample of mass models implemented in ICAROGW as distributions of primary and secondary source masses. The histograms display samples generated from the mass models and the blue solid lines the analytical marginal distributions on the primary and secondary source masses.
Current usage metrics show cumulative count of Article Views (full-text article views including HTML views, PDF and ePub downloads, according to the available data) and Abstracts Views on Vision4Press platform.
Data correspond to usage on the plateform after 2015. The current usage metrics is available 48-96 hours after online publication and is updated daily on week days.
Initial download of the metrics may take a while.