Fig. 6.
Download original image
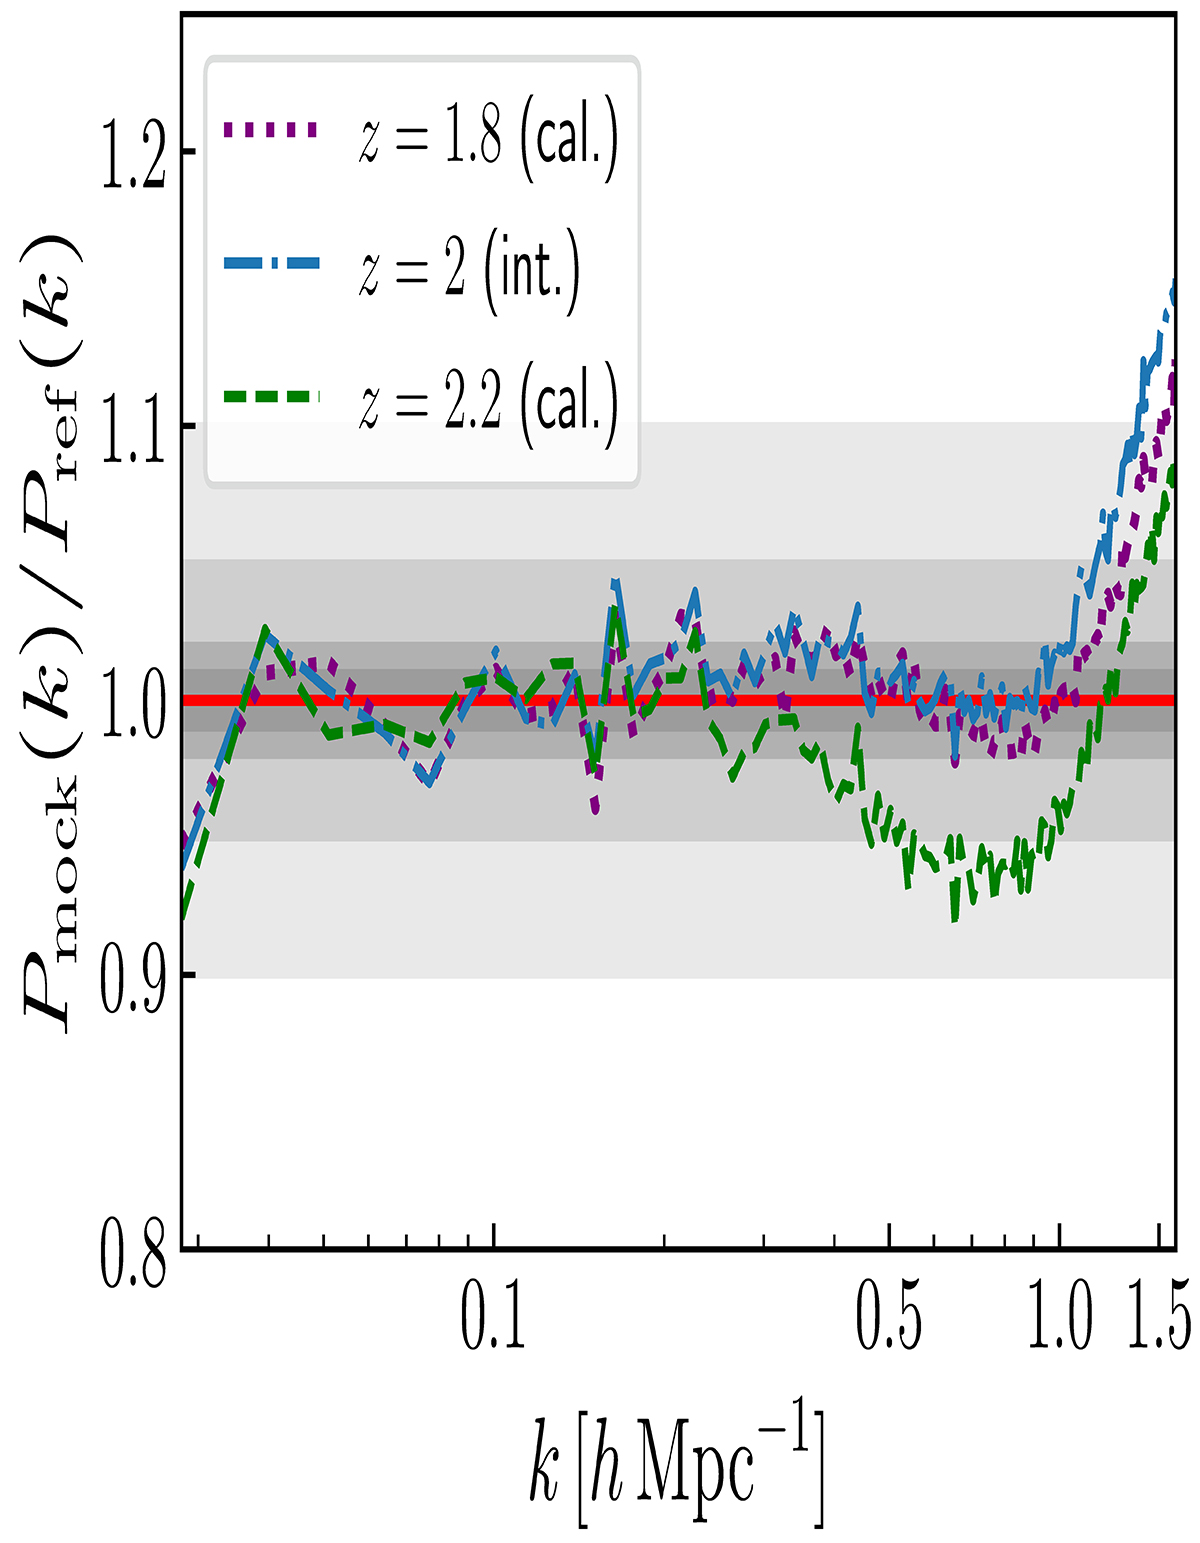
Comparison of 3D Lyα forest power spectrum ratios, Pmock(k)/Pref(k), between the predicted and reference power spectra at different redshifts. Results at z = 1.8 (dotted purple line) and z = 2.2 (dashed green line) are obtained via independent calibrations. Instead, the z = 2 result (dash-dotted blue line) corresponds to the Lyα forest power spectrum that we get by applying the nonlocal FGPA model with parameters linearly interpolated at z = 2 from calibrations at z = 1.8 and z = 2.2. The gray shaded areas stand for 1%,2%,5%, and 10% deviations, from darker to lighter.
Current usage metrics show cumulative count of Article Views (full-text article views including HTML views, PDF and ePub downloads, according to the available data) and Abstracts Views on Vision4Press platform.
Data correspond to usage on the plateform after 2015. The current usage metrics is available 48-96 hours after online publication and is updated daily on week days.
Initial download of the metrics may take a while.