Fig. 5.
Download original image
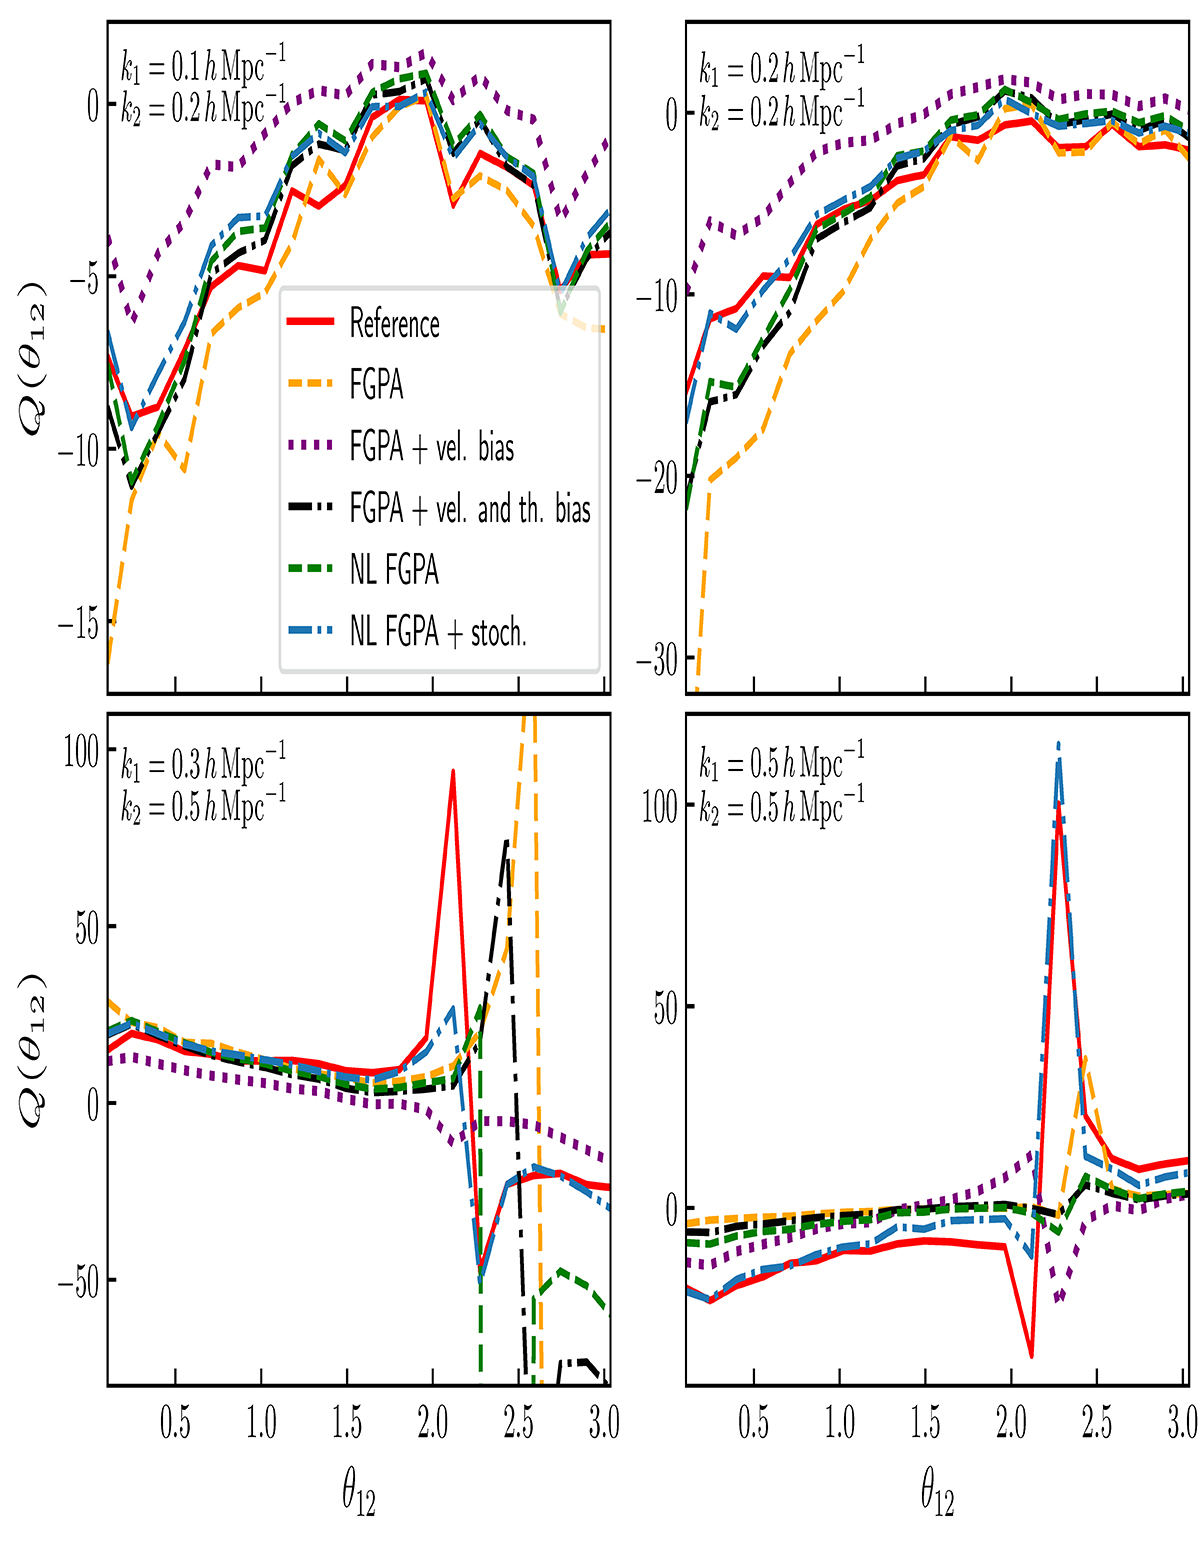
Reduced bispectrum, Q(θ12), as a function of the subtended angle, θ12, for four different triangular configurations: (i) k1 = 0.1, k = 0.2 h Mpc−1 (top left), (ii) k1 = 0.2, k = 0.2 h Mpc−1 (top right), (iii) k1 = 0.3, k = 0.5 h Mpc−1 (bottom left), and (iv) k1 = 0.5, k = 0.5 h Mpc−1 (bottom right). The plot displays the bispectrum of the reference simulation (solid red line), compared to the predictions from the standard FGPA (dashed yellow line), the FGPA with velocity bias (dotted purple line), the FGPA with velocity and threshold bias (dash-dotted black line), the nonlocal FGPA (dashed green line), and the nonlocal FGPA with stochasticity (dash-dotted blue line). The latter (i.e., our preferred model) reproduces the target bispectrum with reasonable accuracy for all the probed triangular configurations, while the others start to feature significant deviations at k ≳ 0.2 h Mpc−1.
Current usage metrics show cumulative count of Article Views (full-text article views including HTML views, PDF and ePub downloads, according to the available data) and Abstracts Views on Vision4Press platform.
Data correspond to usage on the plateform after 2015. The current usage metrics is available 48-96 hours after online publication and is updated daily on week days.
Initial download of the metrics may take a while.