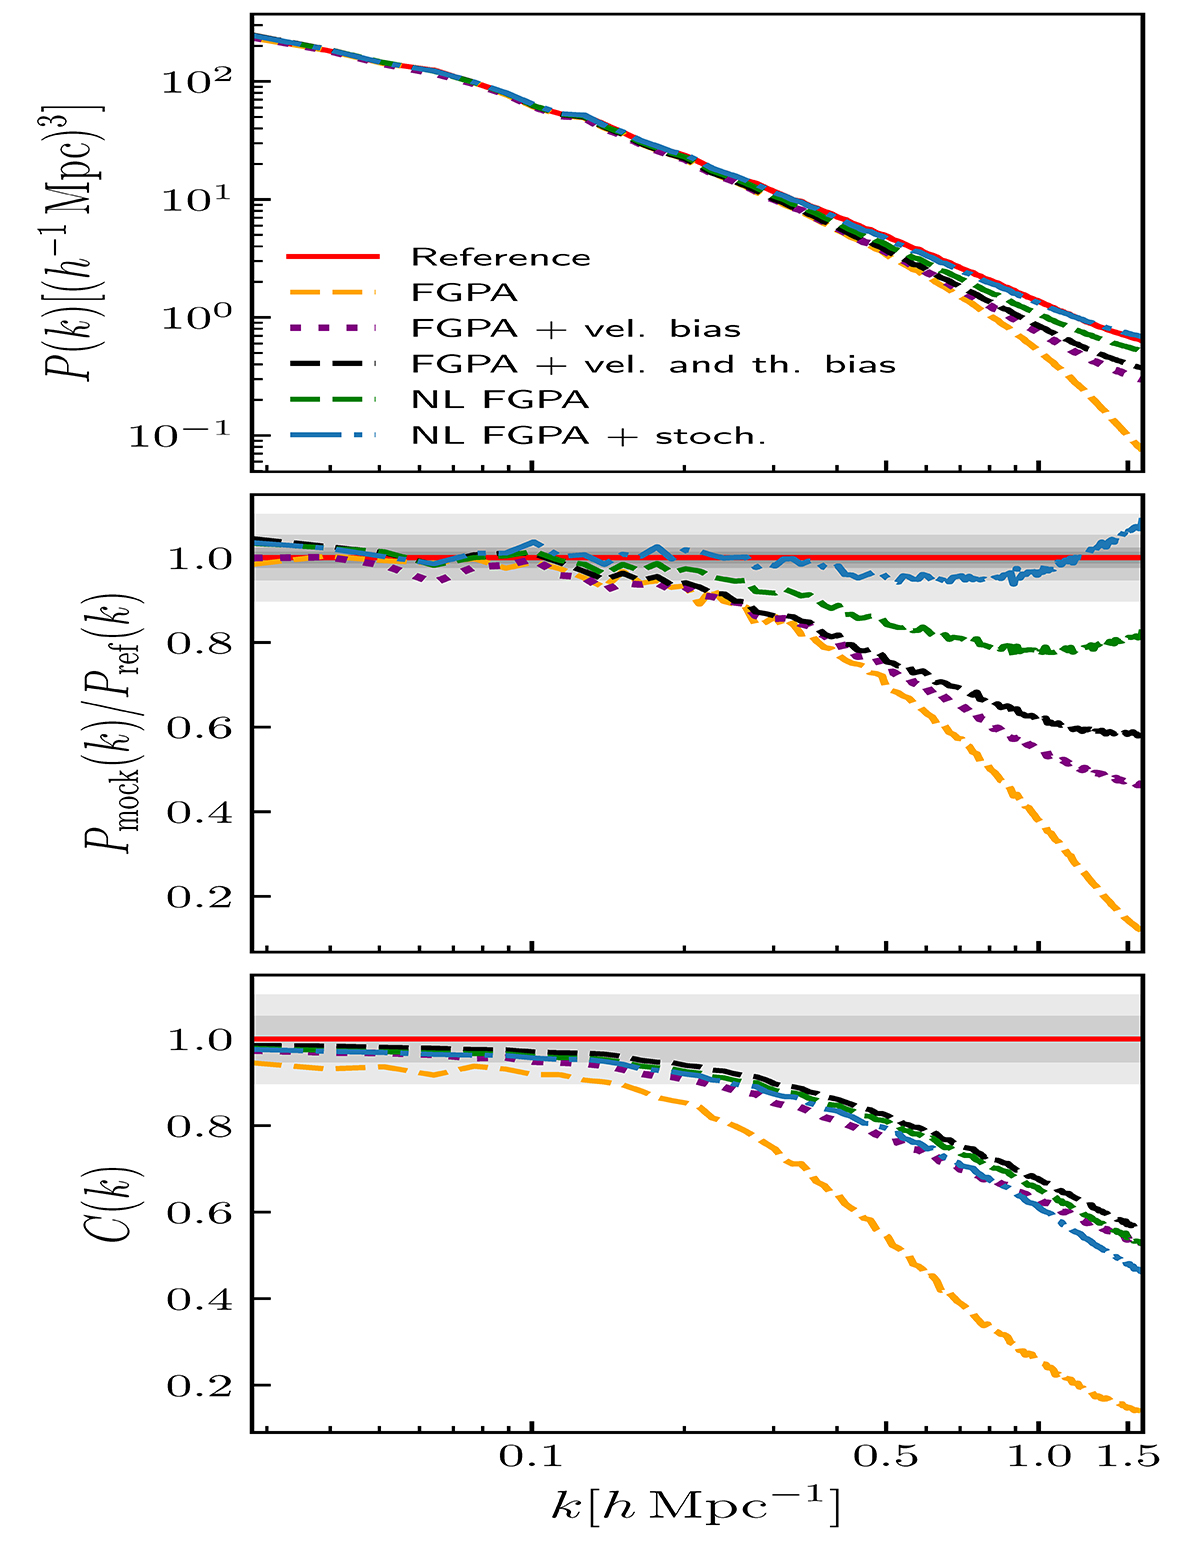
Fig. 4.
Download original image
Top: comparison of the 3D Lyα forest power spectrum, P(k). Middle: comparison of the 3D Lyα forest power spectrum ratios, Pmock(k)/Pref(k), between the predicted and reference power spectra. Bottom: comparison of cross-correlation coefficients, C(k), between the reference Lyα forest and the predictions from the different tested models. In each panel, the investigated reference simulation summary statistics are shown as a solid red line, while the prediction by the standard FGPA is displayed as a dashed yellow line, the FGPA with velocity bias as a dotted purple line, the FGPA with velocity and threshold bias as a dash-dotted black line, the nonlocal FGPA as a dashed green line, and the nonlocal FGPA with stochasticity as a dash-dotted blue line. In the mid panel, the gray shaded areas stand for 1%,2%,5%, and 10% deviations, from darker to lighter. In the bottom panel, the gray shaded areas stand for 5% and 10% deviations, from darker to lighter.
Current usage metrics show cumulative count of Article Views (full-text article views including HTML views, PDF and ePub downloads, according to the available data) and Abstracts Views on Vision4Press platform.
Data correspond to usage on the plateform after 2015. The current usage metrics is available 48-96 hours after online publication and is updated daily on week days.
Initial download of the metrics may take a while.