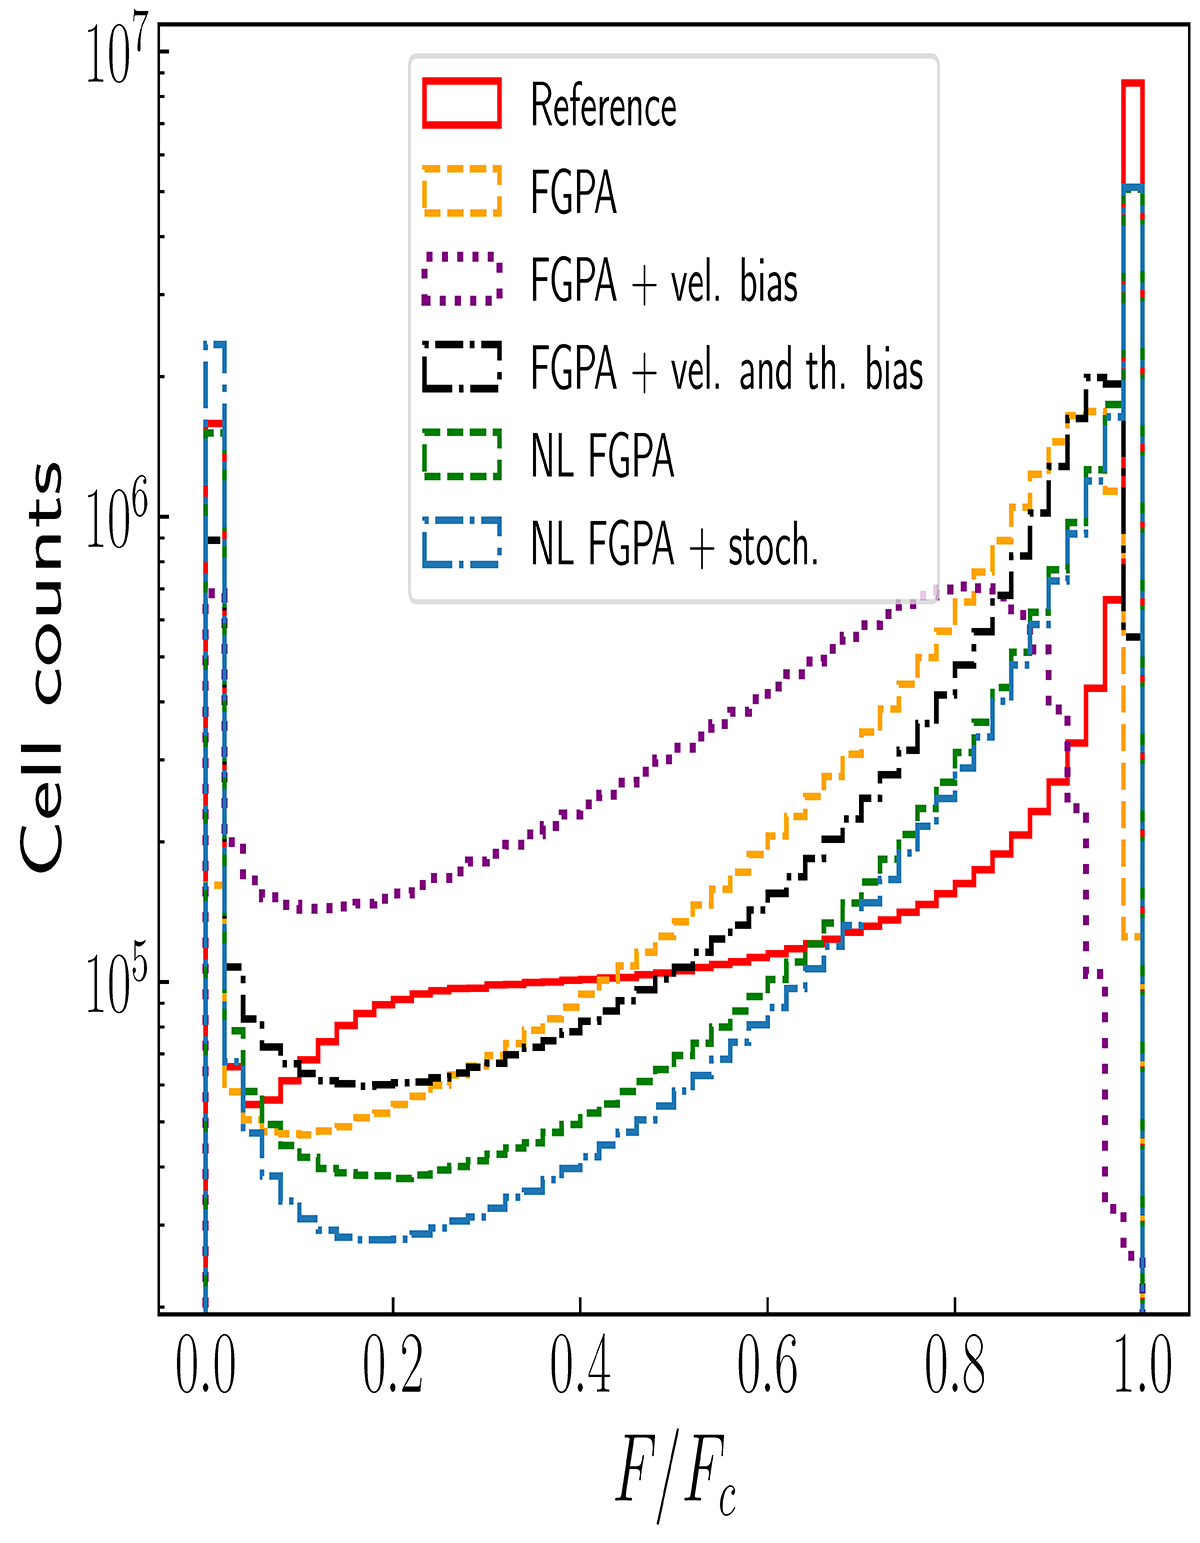
Fig. 3.
Download original image
Comparison between probability distribution functions of transmitted Lyα forest flux F/Fc as extracted from the reference simulation (red solid), and as predicted by the standard FGPA (yellow dashed), by the FGPA with velocity bias (purple dotted), by the FGPA with velocity and threshold bias (black dashed-dotted), by the nonlocal FGPA(green dashed), and by the nonlocal FGPA and stochasticity (blue dashed-dotted).
Current usage metrics show cumulative count of Article Views (full-text article views including HTML views, PDF and ePub downloads, according to the available data) and Abstracts Views on Vision4Press platform.
Data correspond to usage on the plateform after 2015. The current usage metrics is available 48-96 hours after online publication and is updated daily on week days.
Initial download of the metrics may take a while.