Fig. 2.
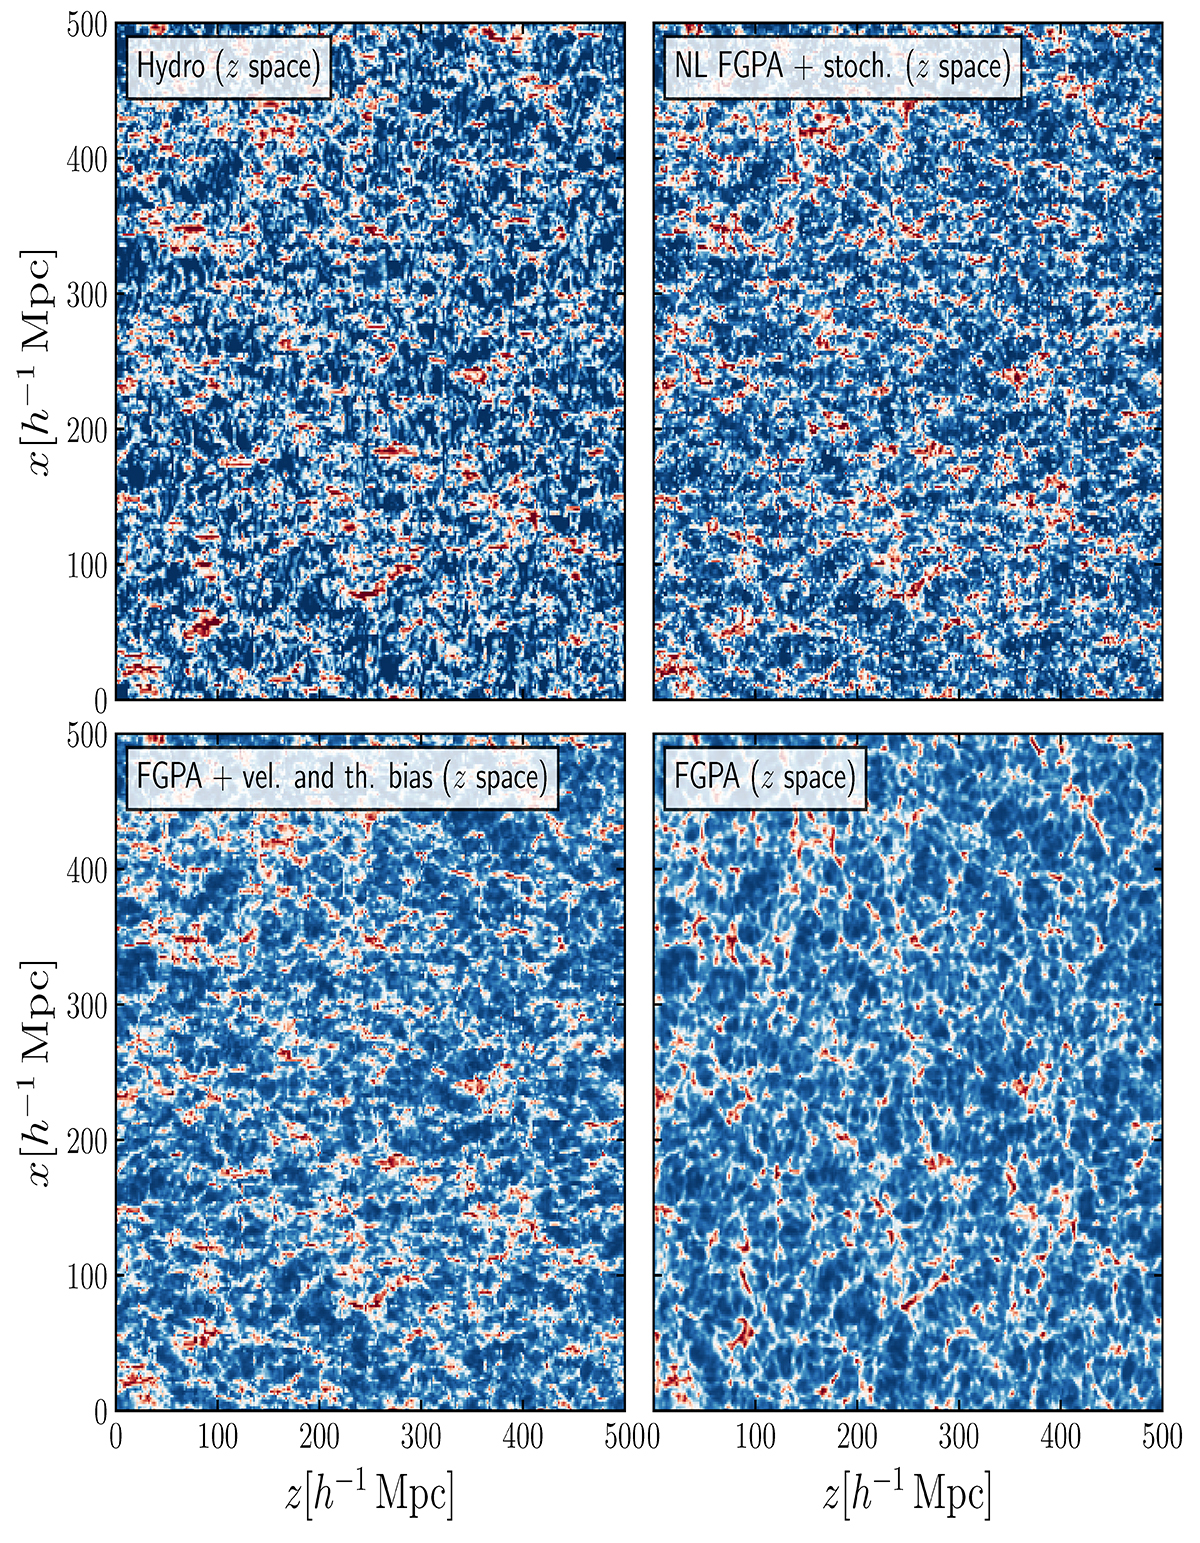
Download original image
Slices through the simulation box, obtained by averaging two contiguous slices 1.95 h−1 Mpc thick parallel to the (x, z) plane, displaying redshift space distortions along the z axis. The plot displays a Lyα forest transmitted flux F/Fc slice through the reference cosmological hydrodynamic simulation (top left), and through the predicted Lyα forest boxes obtained through the standard FGPA (bottom right), a FGPA with a velocity and threshold bias (bottom left), and our final nonlocal cosmic-web-dependent FGPA and stochasticity (top right). The maps are color-coded from red to blue for values ranging in the interval [0.1], where red indicates underdense regions and blue overdense ones. All the slices share the same color scale and the same extrema.
Current usage metrics show cumulative count of Article Views (full-text article views including HTML views, PDF and ePub downloads, according to the available data) and Abstracts Views on Vision4Press platform.
Data correspond to usage on the plateform after 2015. The current usage metrics is available 48-96 hours after online publication and is updated daily on week days.
Initial download of the metrics may take a while.