Open Access
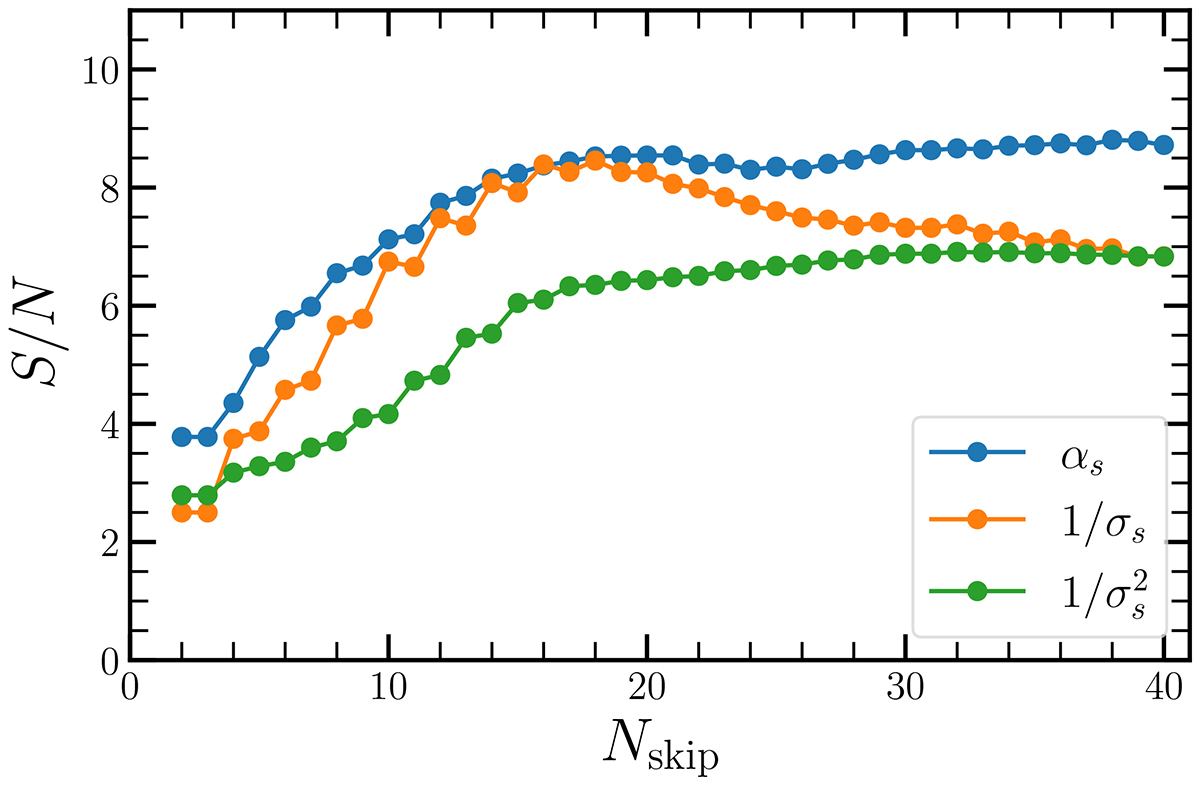
Fig. 9.
Download original image
Signal-to-noise ratio associated with different averages of the seismic travel times versus maximum skip number Nskip used in the average. For all Nskip, the weights αs used in the average (blue) provide a S/N that is higher than the weights proportional to 1/σs (orange) and ![]() (green).
(green).
Current usage metrics show cumulative count of Article Views (full-text article views including HTML views, PDF and ePub downloads, according to the available data) and Abstracts Views on Vision4Press platform.
Data correspond to usage on the plateform after 2015. The current usage metrics is available 48-96 hours after online publication and is updated daily on week days.
Initial download of the metrics may take a while.