Fig. 8.
Download original image
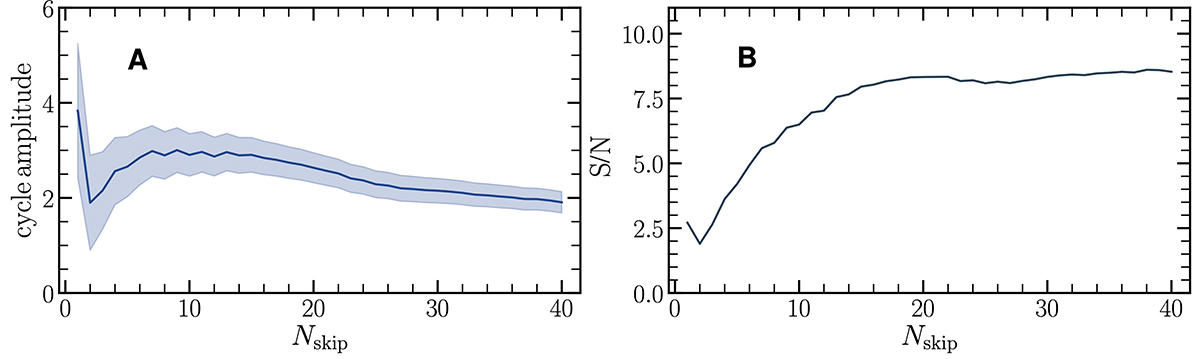
Detectability of the solar cycle in the average VIRGO travel times. (A) Cycle amplitude ![]() versus number of skips Nskip used in the average. The colored area outlines the uncertainty
versus number of skips Nskip used in the average. The colored area outlines the uncertainty ![]() (Eq. (30)). (B) S/N of the 11 yr cycle as a function of Nskip. The data analyzed here were divided into segments of T = 90 days in length with a sampling time of 90 days.
(Eq. (30)). (B) S/N of the 11 yr cycle as a function of Nskip. The data analyzed here were divided into segments of T = 90 days in length with a sampling time of 90 days.
Current usage metrics show cumulative count of Article Views (full-text article views including HTML views, PDF and ePub downloads, according to the available data) and Abstracts Views on Vision4Press platform.
Data correspond to usage on the plateform after 2015. The current usage metrics is available 48-96 hours after online publication and is updated daily on week days.
Initial download of the metrics may take a while.