Fig. 7.
Download original image
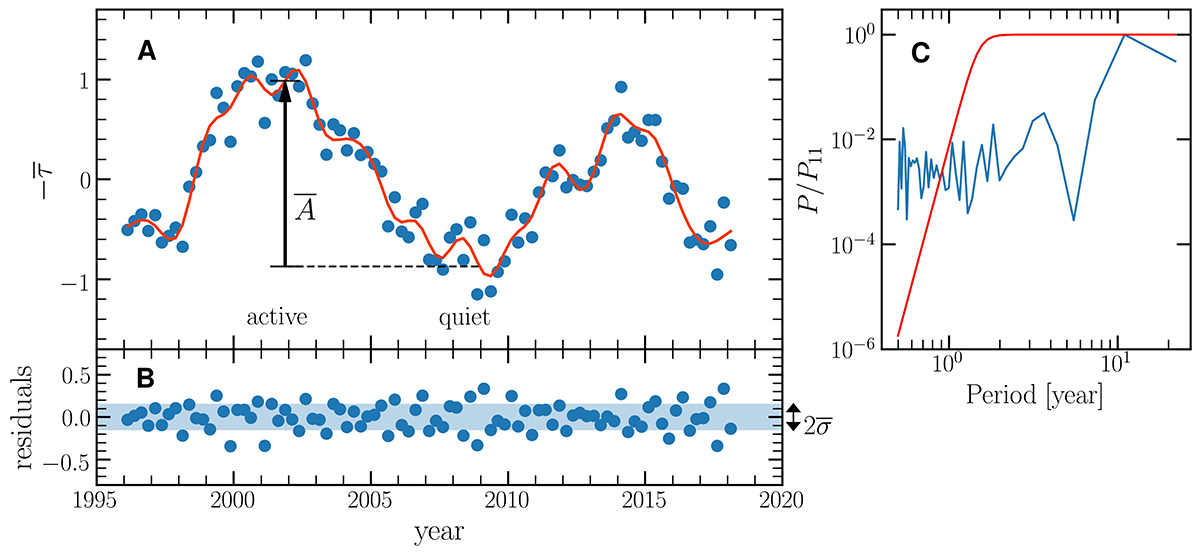
Average seismic travel time. (A) Measured average travel time ![]() (blue points) using Nskip = 40
(blue points) using Nskip = 40 ![]() and the filtered data (red line). The vertical arrow defines the amplitude of the 11 yr cycle measured between active and quiet years. The VIRGO data were divided into segments of length T = 90 days with a sampling time of 90 days. (B) Residuals between
and the filtered data (red line). The vertical arrow defines the amplitude of the 11 yr cycle measured between active and quiet years. The VIRGO data were divided into segments of length T = 90 days with a sampling time of 90 days. (B) Residuals between ![]() and
and ![]() . (C) Power spectrum of
. (C) Power spectrum of ![]() (blue curve) normalised to P11 = P (period = 11 yr). The red curve shows the Butterworth filter with a cutoff at 1.5 yr.
(blue curve) normalised to P11 = P (period = 11 yr). The red curve shows the Butterworth filter with a cutoff at 1.5 yr.
Current usage metrics show cumulative count of Article Views (full-text article views including HTML views, PDF and ePub downloads, according to the available data) and Abstracts Views on Vision4Press platform.
Data correspond to usage on the plateform after 2015. The current usage metrics is available 48-96 hours after online publication and is updated daily on week days.
Initial download of the metrics may take a while.