Fig. 6.
Download original image
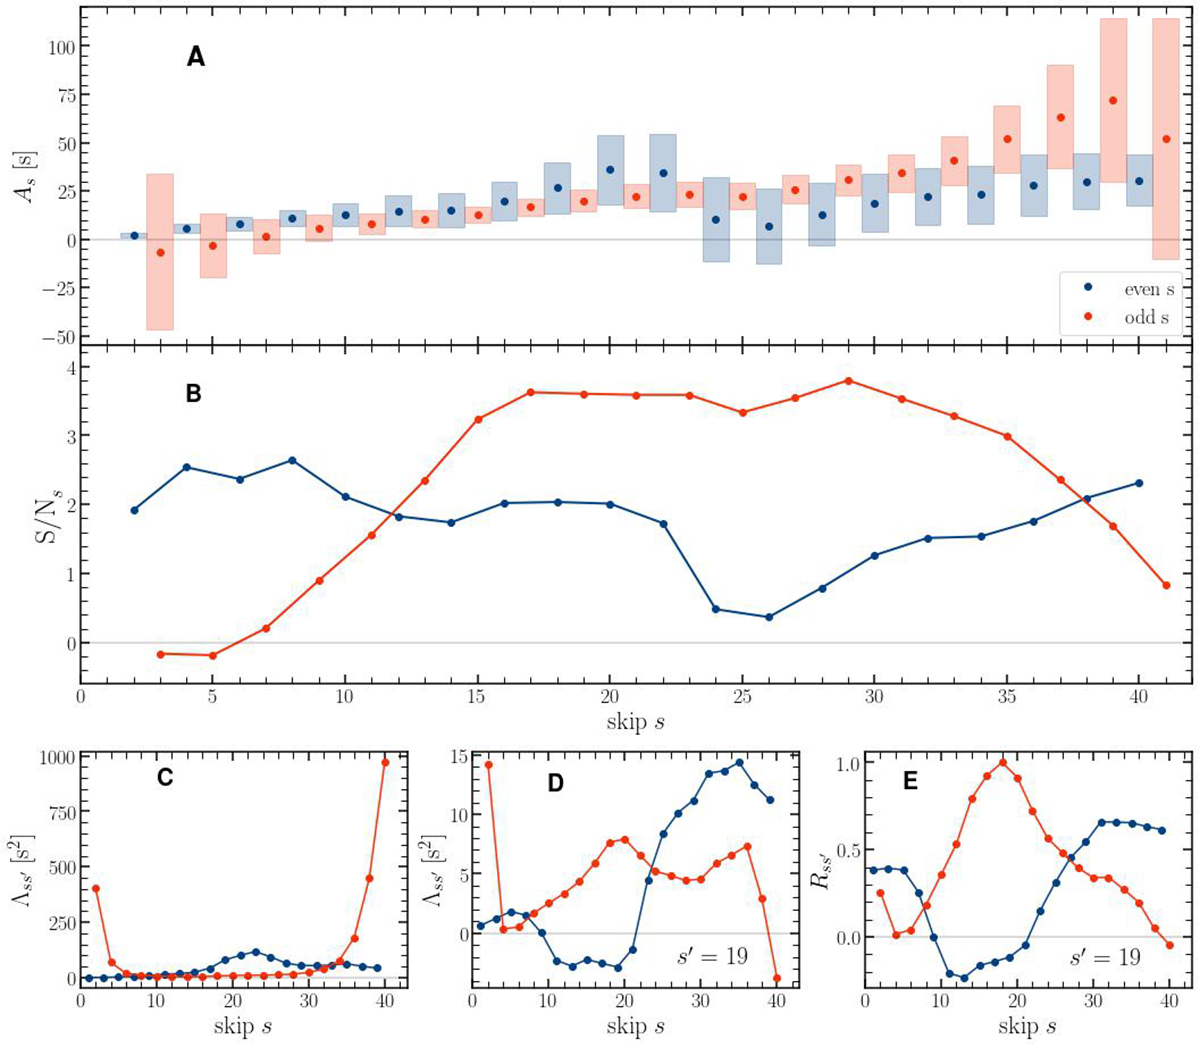
Detectability of the solar cycle in individual skip travel times. (A) Amplitudes of travel-time variations due to the solar cycle, As, versus skip number s (see Eq. (18)), with error bars of ![]() (see Eq. (19)). (B) Signal-to-noise ratios
(see Eq. (19)). (B) Signal-to-noise ratios ![]() . (C) Variance of travel-time noise
. (C) Variance of travel-time noise ![]() . (D) Plot of Λs, s′ = 19 and (E) plot of Rs, s′ = 19. In all panels, the blue and red points show the even and odd values of s.
. (D) Plot of Λs, s′ = 19 and (E) plot of Rs, s′ = 19. In all panels, the blue and red points show the even and odd values of s.
Current usage metrics show cumulative count of Article Views (full-text article views including HTML views, PDF and ePub downloads, according to the available data) and Abstracts Views on Vision4Press platform.
Data correspond to usage on the plateform after 2015. The current usage metrics is available 48-96 hours after online publication and is updated daily on week days.
Initial download of the metrics may take a while.