Fig. 5.
Download original image
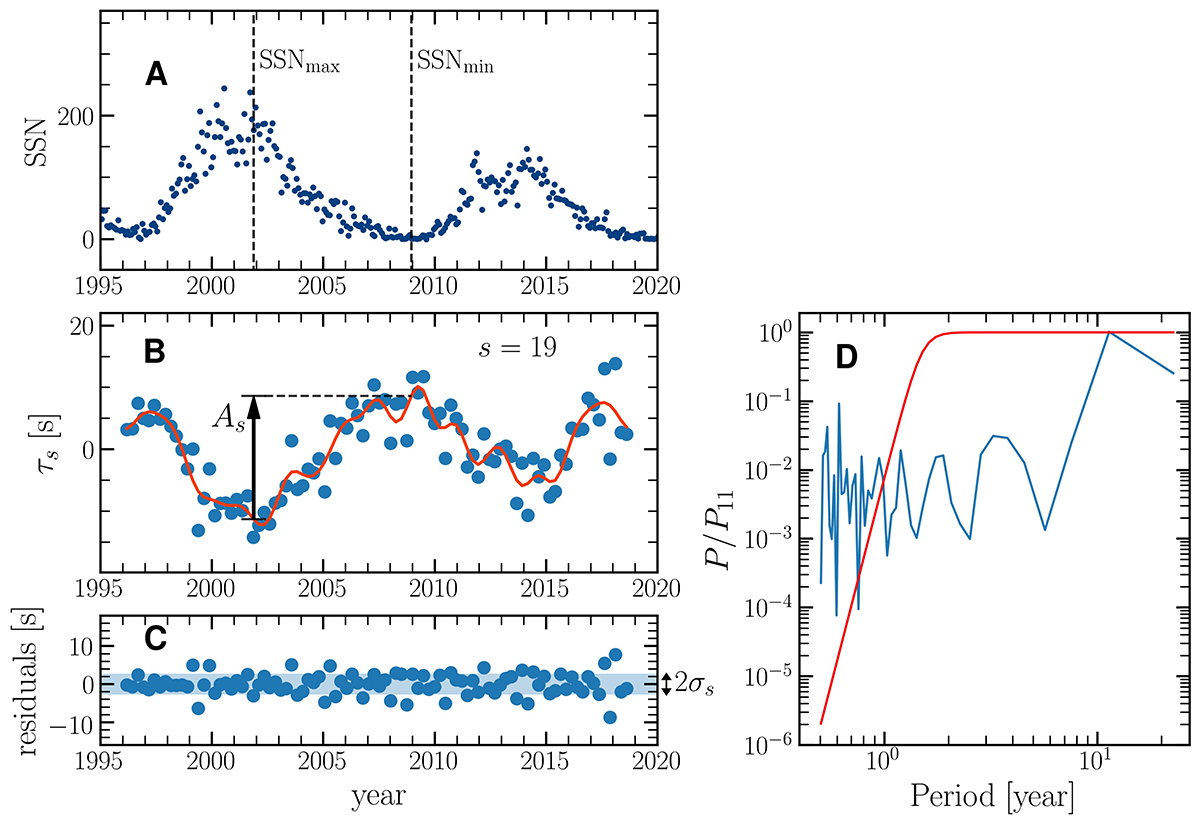
Comparison between the sunspot number (SSN) smoothed over 13 months (A) and seismic travel times, τs, for skip number s = 19 (B) measured in the red VIRGO/SPM channel data. Vertical dashed lines indicate cycle maximum and minimum. The red line represents the filtered data, τs, smooth(t), which we use to measure the amplitude of the travel-time variations due to the solar cycle As (black arrow). (C) Residuals between τs and τs, smooth. (D) Power spectrum of τs, normalized to the power of the 11-yr harmonic. A Butterworth filter (red line) is used to extract τs, smooth(t).
Current usage metrics show cumulative count of Article Views (full-text article views including HTML views, PDF and ePub downloads, according to the available data) and Abstracts Views on Vision4Press platform.
Data correspond to usage on the plateform after 2015. The current usage metrics is available 48-96 hours after online publication and is updated daily on week days.
Initial download of the metrics may take a while.