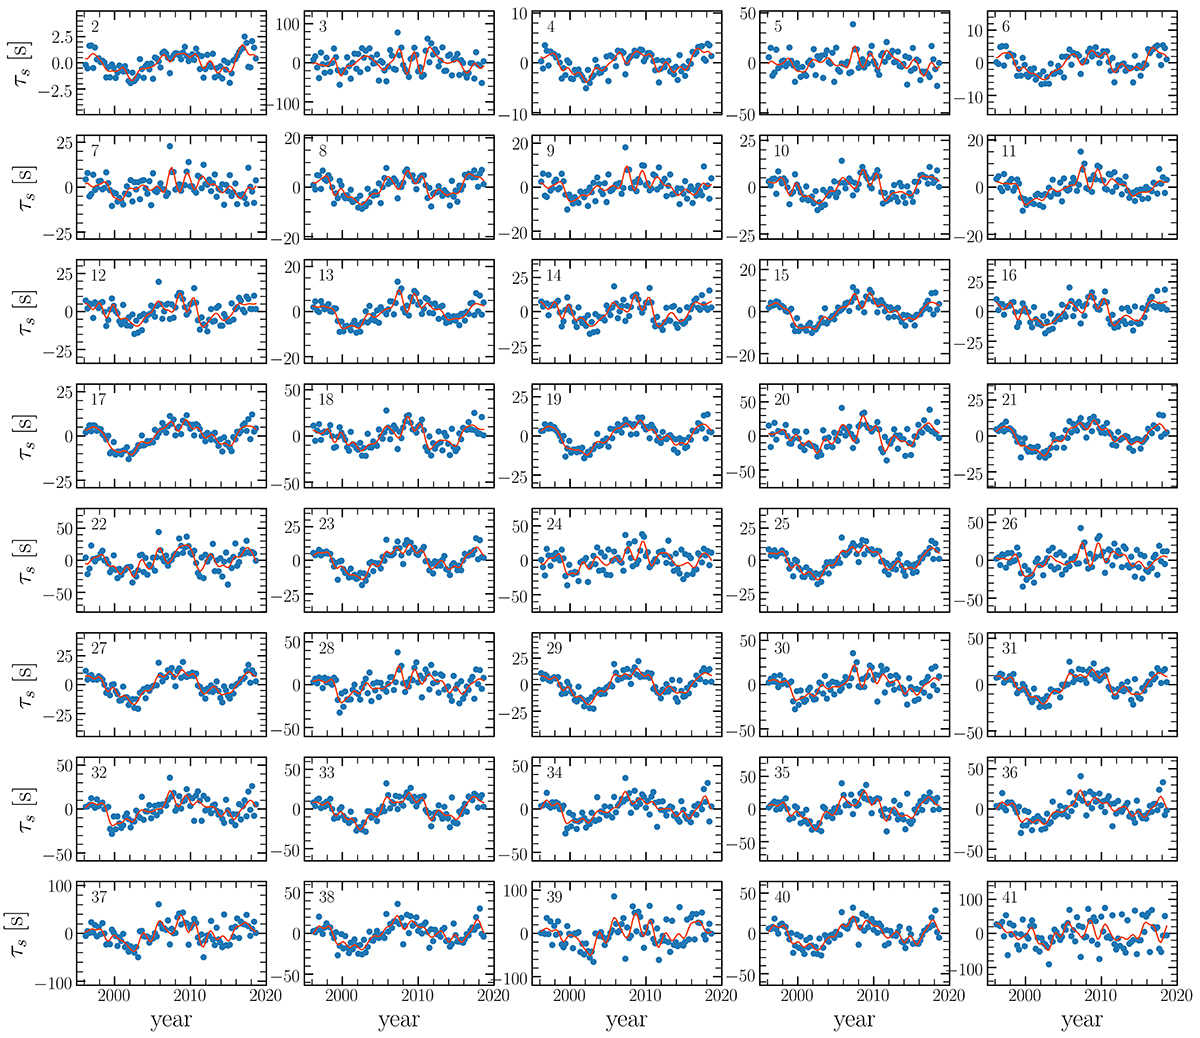
Fig. 4.
Download original image
Measured travel times τs(ti) for all wavepackets with s ≤ 41. The red curves show the filtered data τs, smooth(ti) according to Eq. (15). The value of s is written in the top left corner of each plot. The data analyzed here are from VIRGO/SPM (red channel) divided into non-overlapping segments of T = Δt = 90 days in length (see Fig. 2).
Current usage metrics show cumulative count of Article Views (full-text article views including HTML views, PDF and ePub downloads, according to the available data) and Abstracts Views on Vision4Press platform.
Data correspond to usage on the plateform after 2015. The current usage metrics is available 48-96 hours after online publication and is updated daily on week days.
Initial download of the metrics may take a while.