Fig. 3.
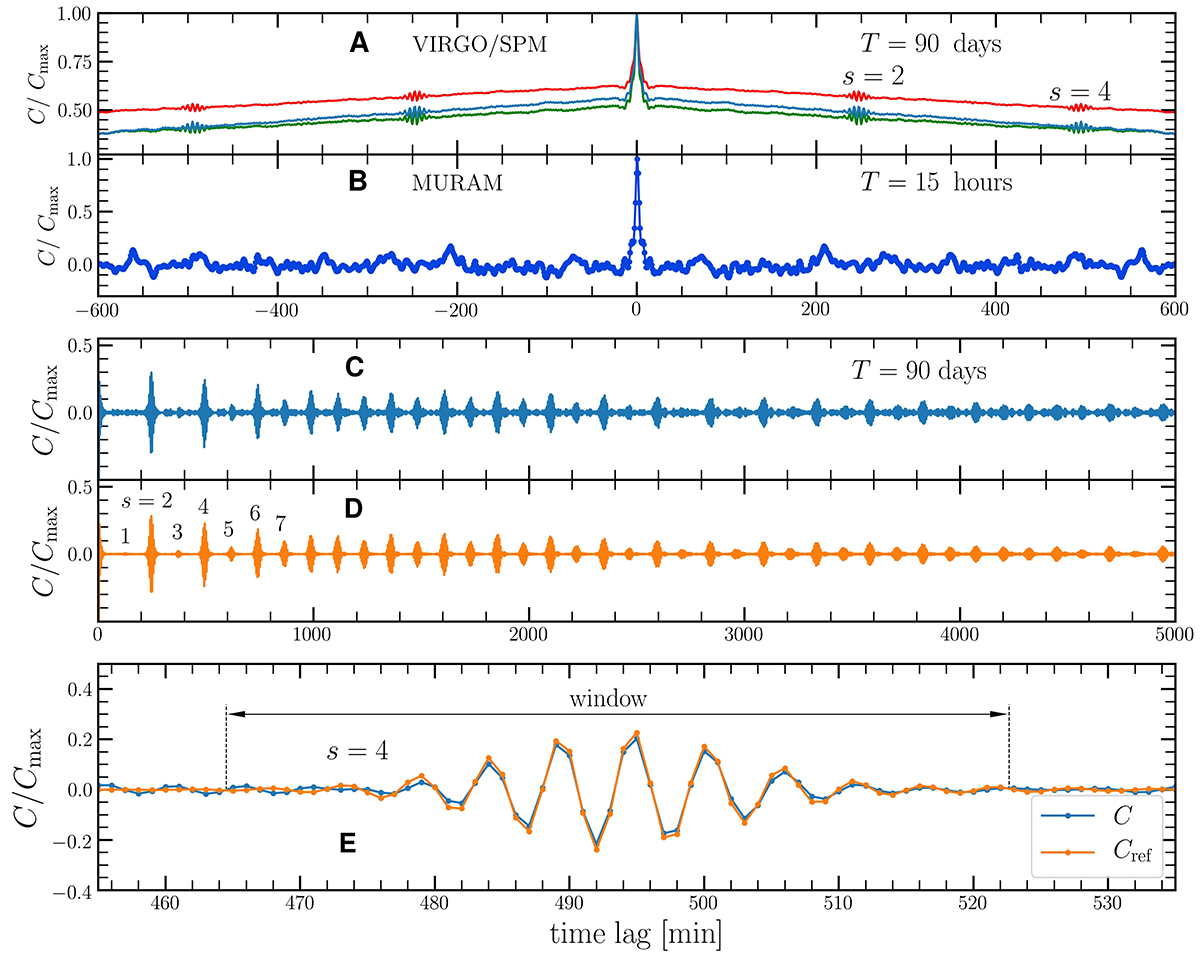
Download original image
Autocovariance functions of intensity time series. (A) Autocovariance function of the VIRGO/SPM data (T = 90 d). The red, green, and blue curves correspond to the three channels. (B) Autocovariance of MURaM solar convection simulations (T = 15 h). (C) Autocovariance function for the p-mode data computed for a segment of VIRGO data with T = 90 days (red channel). (D) Reference autocovariance function obtained by averaging over M = 91 consecutive segments covering 22 yr. The first seven wavepackets are labeled s = 1 through 7. The curves in panels C and D are computed from filtered time series (Gaussian filter centered on 3 mHz with a full width of 2 mHz). (E) Zoom onto wavepacket s = 4 and width of the temporal window function f4(t).
Current usage metrics show cumulative count of Article Views (full-text article views including HTML views, PDF and ePub downloads, according to the available data) and Abstracts Views on Vision4Press platform.
Data correspond to usage on the plateform after 2015. The current usage metrics is available 48-96 hours after online publication and is updated daily on week days.
Initial download of the metrics may take a while.