Fig. 15.
Download original image
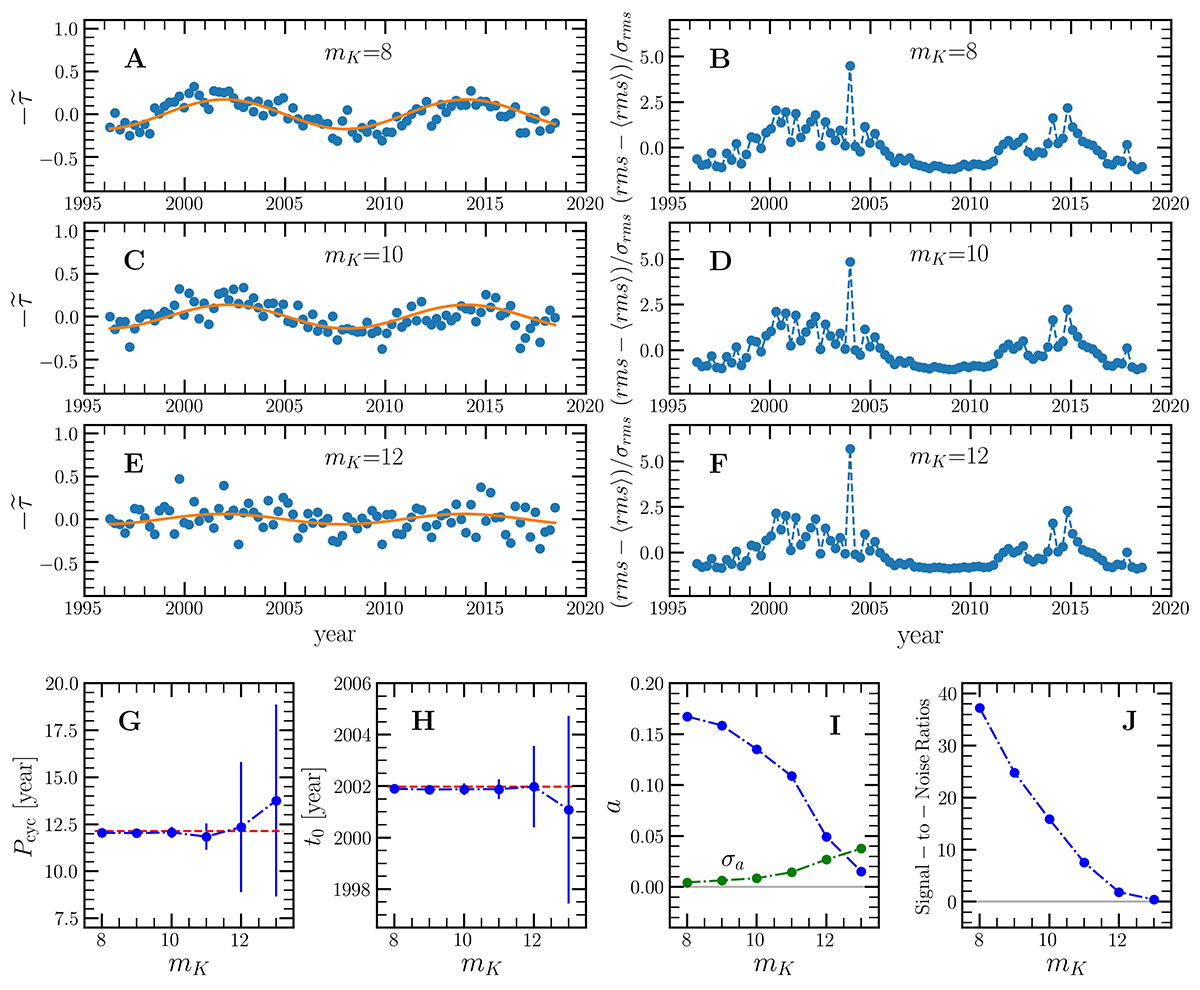
Detectability of the solar cycle in the average travel times in a case of Sun-as-a-Kepler-star observations. (A, C, E) Simulated travel times for distant solar analogs obtained by adding photon noise to the VIRGO observations. The apparent Kepler magnitude mK is indicated on each panel. (B, D, F) Photometric variability (rms) from the same simulated time series. (G–I) Cycle parameters extracted from fits to the travel times (orange curves in panels A, C, E), ![]() . The means and the error bars are estimated from 20 independent realizations. The green curve shows the standard deviation of the cycle amplitude a, denoted by σa. (J) S/N for the activity cycle amplitude, a/σa, versus Kepler magnitude.
. The means and the error bars are estimated from 20 independent realizations. The green curve shows the standard deviation of the cycle amplitude a, denoted by σa. (J) S/N for the activity cycle amplitude, a/σa, versus Kepler magnitude.
Current usage metrics show cumulative count of Article Views (full-text article views including HTML views, PDF and ePub downloads, according to the available data) and Abstracts Views on Vision4Press platform.
Data correspond to usage on the plateform after 2015. The current usage metrics is available 48-96 hours after online publication and is updated daily on week days.
Initial download of the metrics may take a while.