Fig. 13.
Download original image
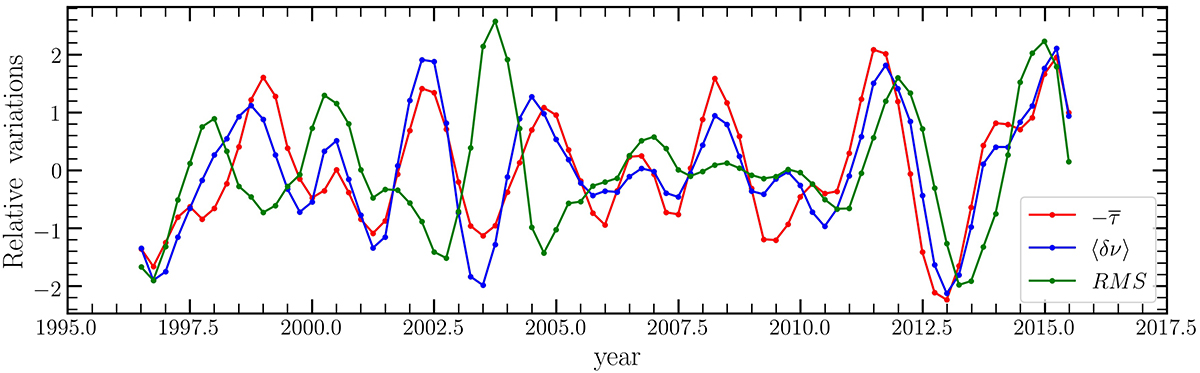
Quasi-biennial variations in ![]() and ⟨δν⟩, and rms time series during solar cycles 23 and 24, normalized by their standard deviations. The data analyzed here were divided into overlapping segments of T = 365 days in length with a sampling time of 91.25 days. The three data sets were filtered in the range 1.5–3.5 yr using a Gaussian filter.
and ⟨δν⟩, and rms time series during solar cycles 23 and 24, normalized by their standard deviations. The data analyzed here were divided into overlapping segments of T = 365 days in length with a sampling time of 91.25 days. The three data sets were filtered in the range 1.5–3.5 yr using a Gaussian filter.
Current usage metrics show cumulative count of Article Views (full-text article views including HTML views, PDF and ePub downloads, according to the available data) and Abstracts Views on Vision4Press platform.
Data correspond to usage on the plateform after 2015. The current usage metrics is available 48-96 hours after online publication and is updated daily on week days.
Initial download of the metrics may take a while.