Fig. 11.
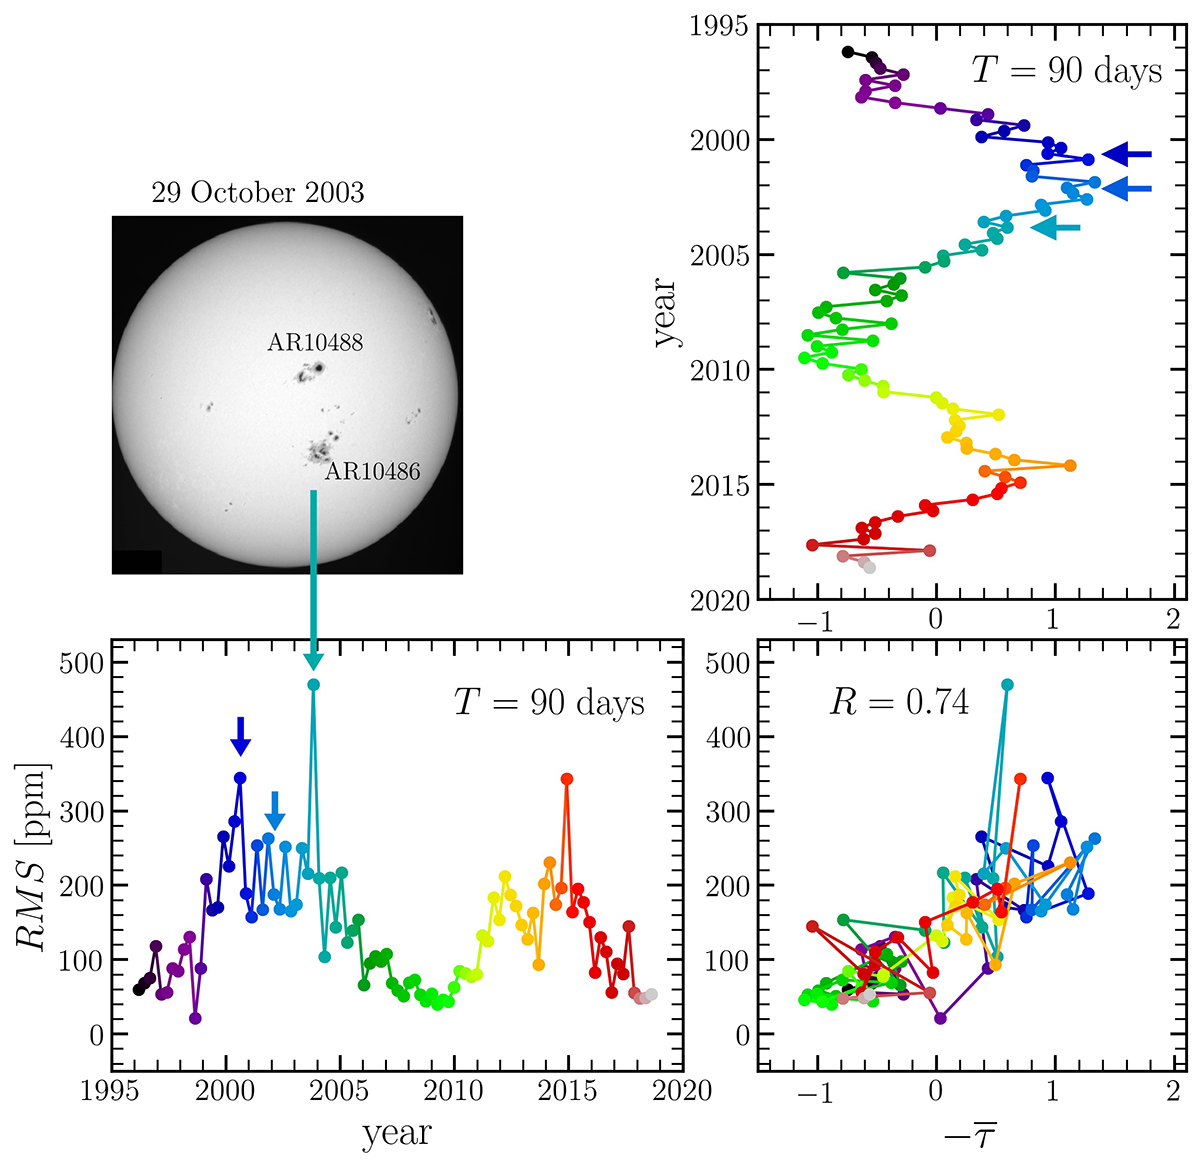
Download original image
Comparison between photometric variability and travel-time perturbations. Bottom left panel: photometric variability computed from nonoverlapping time segments of T = 90 days in duration. The three arrows correspond to three particular times in July 2000, September 2001, and October 2003. The strong spike in the data in October 2003 is due to the transit of two large active regions (top left panel). Top right panel: seismic travel times computed for the same 90 day time segments. As above, the three arrows point to July 2000, September 2001, and October 2003. Bottom right panel: scatter plot between photometric variability and seismic travel times. The correlation coefficient between these datasets is R = 0.74.
Current usage metrics show cumulative count of Article Views (full-text article views including HTML views, PDF and ePub downloads, according to the available data) and Abstracts Views on Vision4Press platform.
Data correspond to usage on the plateform after 2015. The current usage metrics is available 48-96 hours after online publication and is updated daily on week days.
Initial download of the metrics may take a while.